조직 선택
R Square Value Is Different in Tableau and Excel
게시 일자: Apr 29, 2025
상세 설명
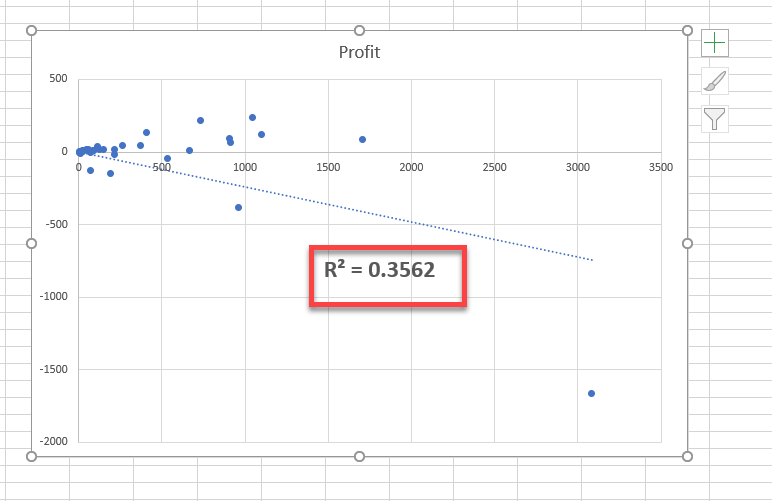
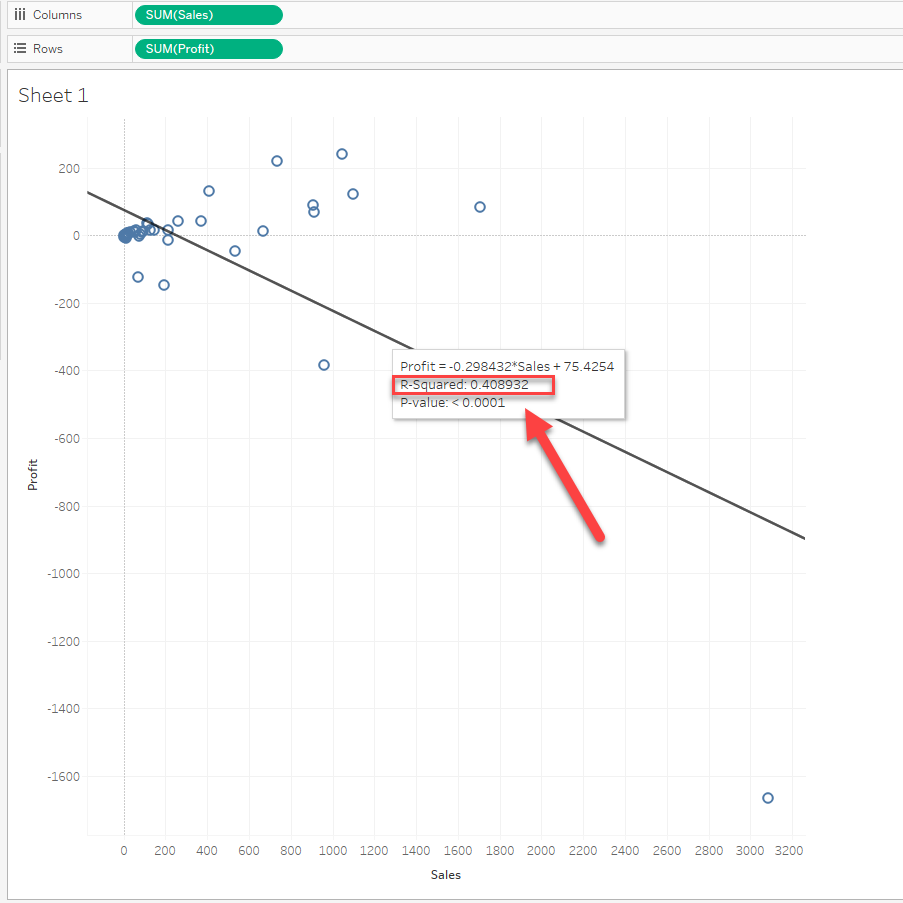
R square is different in Excel and Tableau.
(0.3562 and 0.4089)
Cause
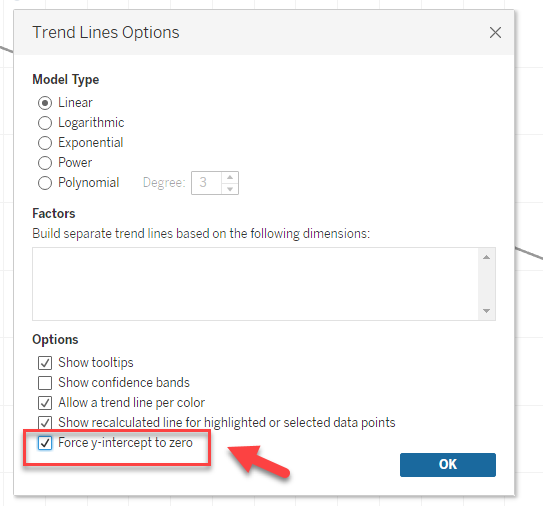
By default, the linear trend line y-intercept is not set to zero in Tableau.So when the y-intercept is set to zero in Excel, the R Square values are different.
솔루션
Check the box of [Trend Lines Options] > [Force y-intercept to zero].
추가 자원
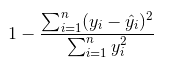
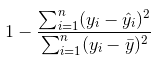
While the normal R Square calculation is as follows:
Knowledge 기사 번호
001471374
이 기사를 통해 문제를 해결했습니까?
개선을 위한 의견을 보내주세요.