Sélectionner une organisation
How To Fix Color Separation Rather Than Gradient in Line Chart
Date de publication: Apr 24, 2025
Description
Cause
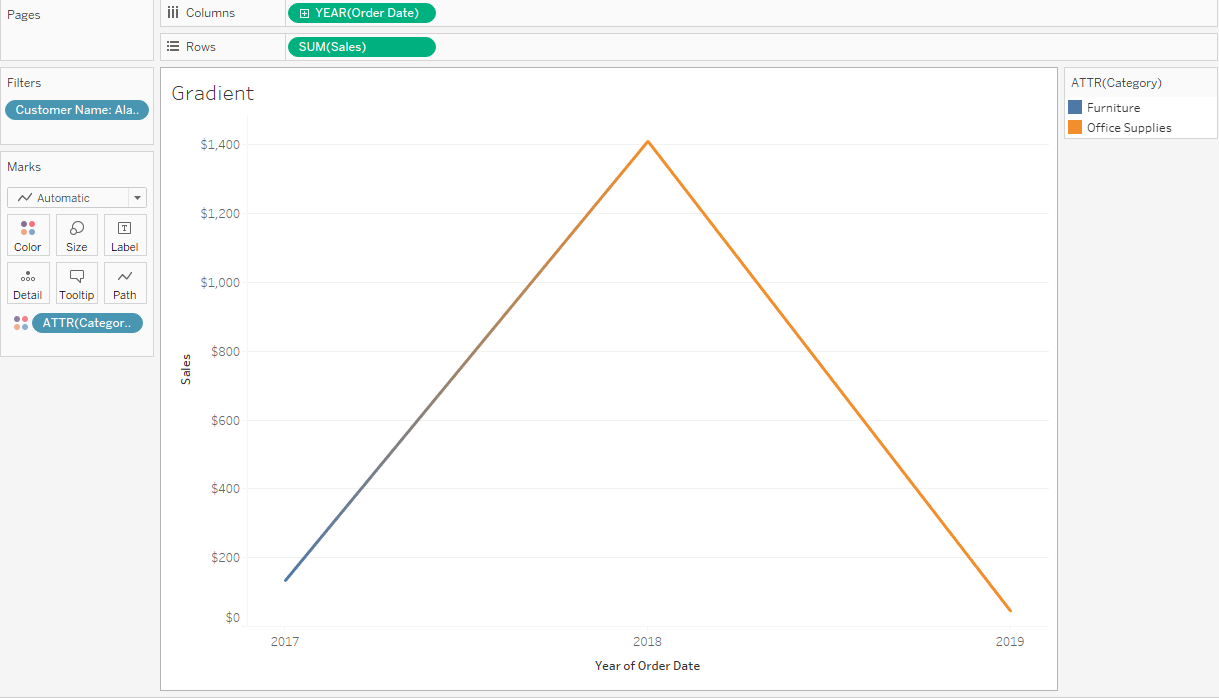
The ability to fix color separation in a line chart is currently not build in a product.Résolution
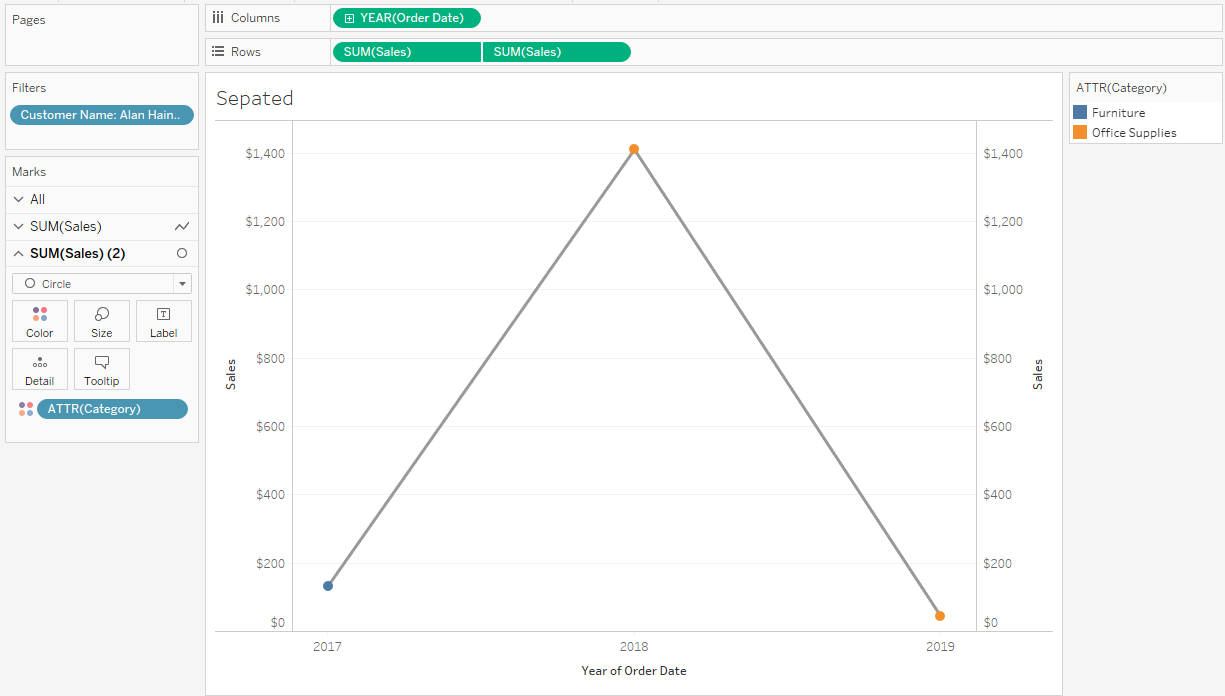
Here are steps demonstrated in the attached workbook.
- Place Order Date to columns and select continuous year.
- Place Sales to rows.
- Place Category to color and right click to set to Attribute.
- Place one more Sales to columns and right click Dual Axis.
- Open SUM(Sales) mark card and remove Category from color.
- Open SUM(Sales)(2) mark card and change mark type to Circle.
- Right click the right Y axis and click Synchronized Axis.
Numéro d’article de la base de connaissances
001472357
Cet article a-t-il résolu votre problème ?
Dites-nous ce que nous pouvons améliorer !