Velg en organisasjon
How To Fix Color Separation Rather Than Gradient in Line Chart
Publiseringsdato: Apr 24, 2025
Beskrivelse
Cause
The ability to fix color separation in a line chart is currently not build in a product.Løsning
Here are steps demonstrated in the attached workbook.
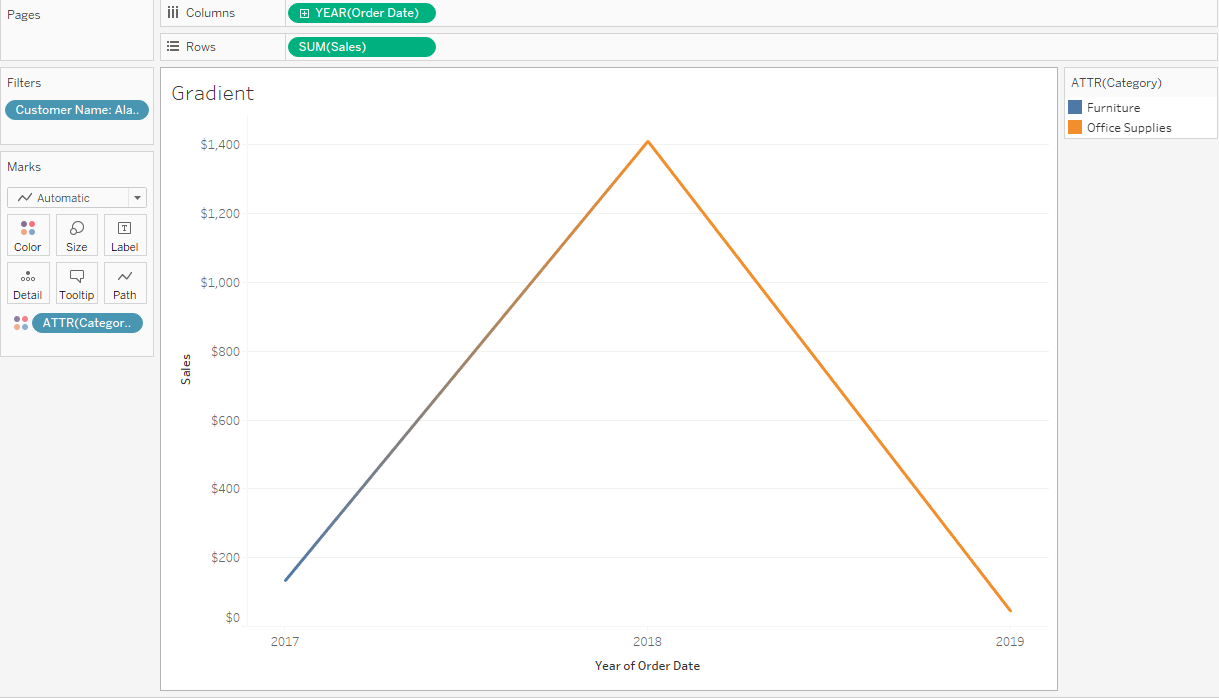
- Place Order Date to columns and select continuous year.
- Place Sales to rows.
- Place Category to color and right click to set to Attribute.
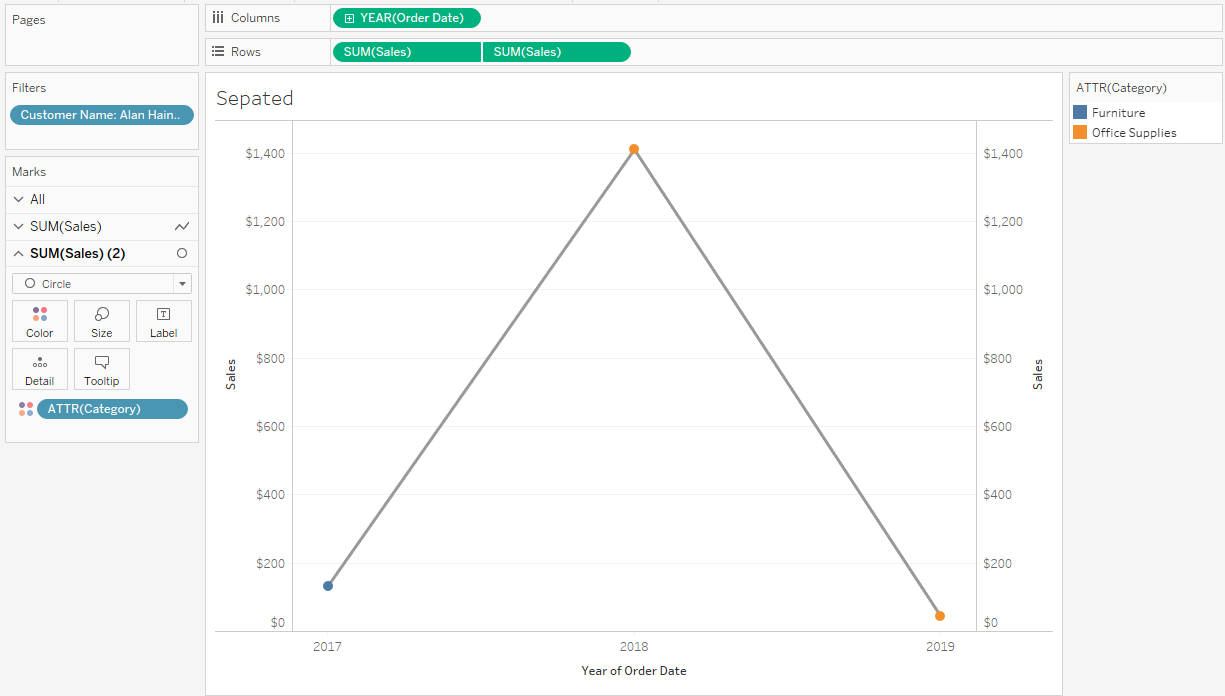
- Place one more Sales to columns and right click Dual Axis.
- Open SUM(Sales) mark card and remove Category from color.
- Open SUM(Sales)(2) mark card and change mark type to Circle.
- Right click the right Y axis and click Synchronized Axis.
Knowledge-artikkelnummer
001472357
Hjalp denne artikkelen med å løse problemet ditt?
La oss få vite det slik at vi kan forbedre!