Vælg en organisation
How to display both Total and Average using the Grand Total in Crosstab in Tableau Desktop
Udgivelsesdato: Sep 24, 2025
Beskrivelse
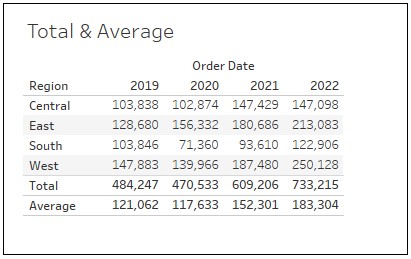
How to display both the Total and Average with the Grand Total in the crosstab.
Cause
This feature is not built in Tableau Desktop yet.Løsning
<Example>

<Steps>
-Create The Total Sheet-
1. Connect to Sample Superstore
2. Drag [Order Date] to Columns and [Region] to Rows.
3. Drag [Sales] to Text in Marks.
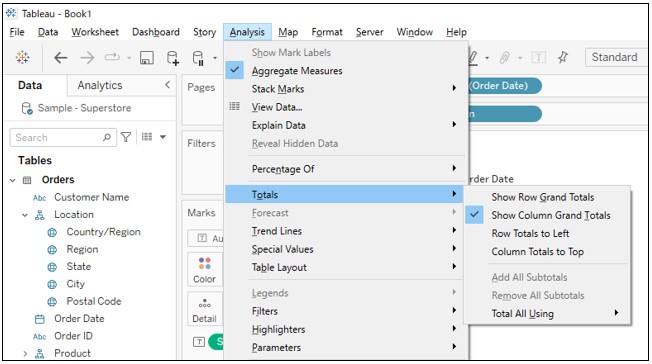
4. Toolbar > Analysis > Totals > Show Column Grand Totals.
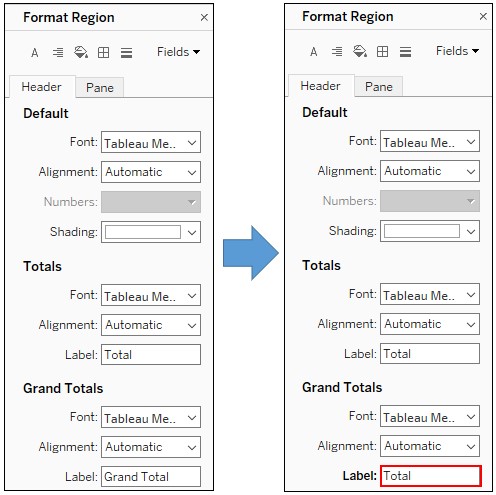
5. Right click on Grand Total on the crosstab > Format > Change the Label to Total.
6. Duplicate the sheet1.
-Create The Average Sheet-
7. Go to the duplicated sheet.
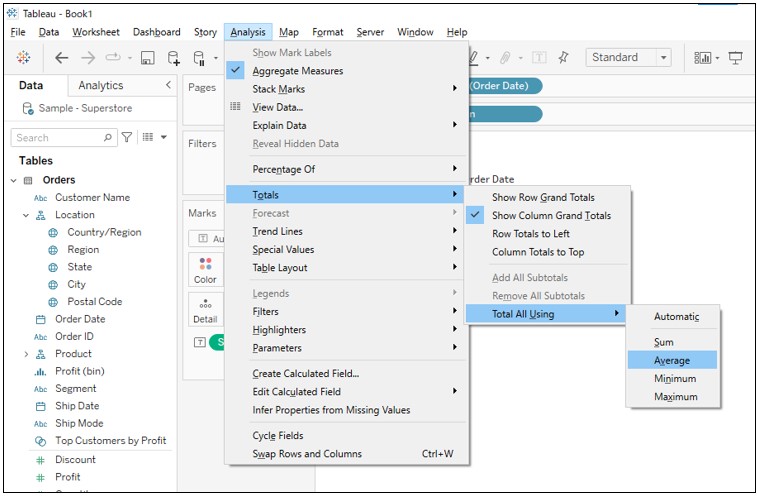
8. Toolbar > Analysis > Totals > Total All Using > Average.
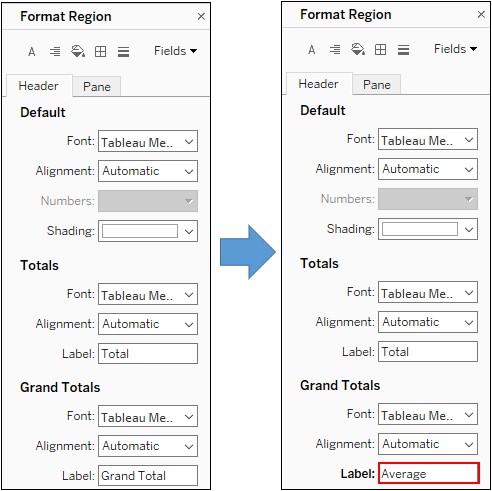
9. Right click on Total on the crosstab > Format > Change the Label to Total.
-Create Dashboard-
10. Create New Dashboard.
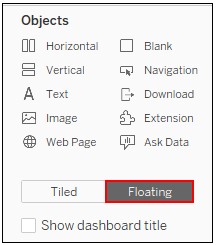
11. Click on Floating.
12. Drag Sheet 1 to dashboard.
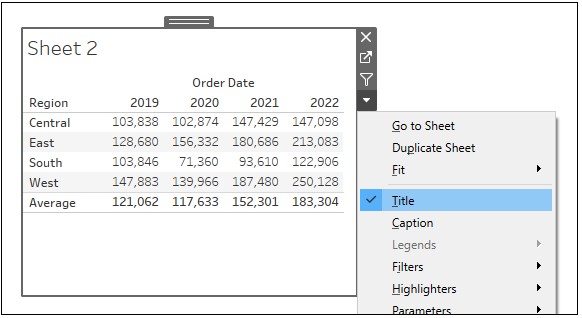
13. Drag Sheet 2 to dashboard > Click on Title to hide title.
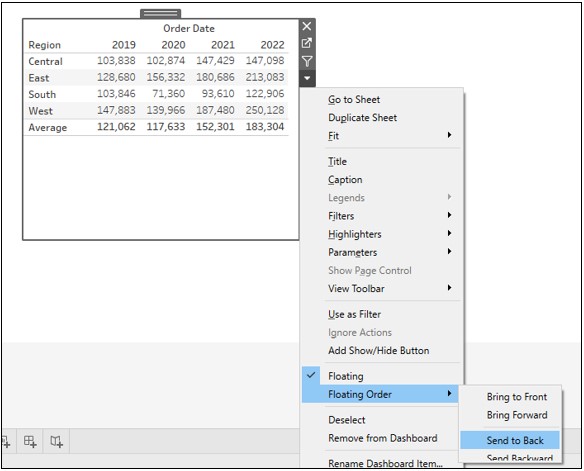
14. Set Floating Order on Sheet 2 back.
15. Adjust the Average row of Sheet 2 to be placed below the Total row of Sheet 1
Vidensartikelnummer
001534606
Løste denne artikel dit problem?
Giv os besked, så vi kan forbedre os!