조직 선택
Proactive Alert Monitoring: Apex CPU Timeout Exceptions
게시 일자: Oct 25, 2024
상세 설명
Salesforce imposes a limit on the CPU usage that can be consumed in a given transaction, which is roughly 10 seconds for Synchronous and 60 seconds for Asynchronous Apex. An Apex CPU Timeout Exception effectively means that Apex Code (or process builder/ flows or both) is attempting to execute and is exceeding the CPU time limit. Any DML executions contained within the transaction will be rolled back if this limit is hit.
Signature Success Plan's Proactive Monitoring product will monitor for, and alert you to high error volumes of this type. This article outlines some scenarios to help you investigate if you receive an alert. Also, on the Salesforce Help site, designated contacts and above can see your realtime metrics, alerts & more.
If you receive the following error message, your organization might be hitting the timeout limit for transactions based on CPU usage.
Full Message Error Text: Apex CPU time limit exceeded
Causes
When the limit is exceeded, transactions from APEX classes will encounter this exception. This alert provides visibility into when these errors are occurring for a customer so that corrective actions can be taken.
Errors of this nature can often be introduced by:
- All Apex code
- Library functions exposed in Apex
- Workflow executions
User Flow and Investigation
Please visit help.salesforce.com and navigate to the Customer Success Score (CSS) tab to learn more about this error. In the same UI, navigate to the Signal Details view in the Technical Health section of the score, as displayed below:
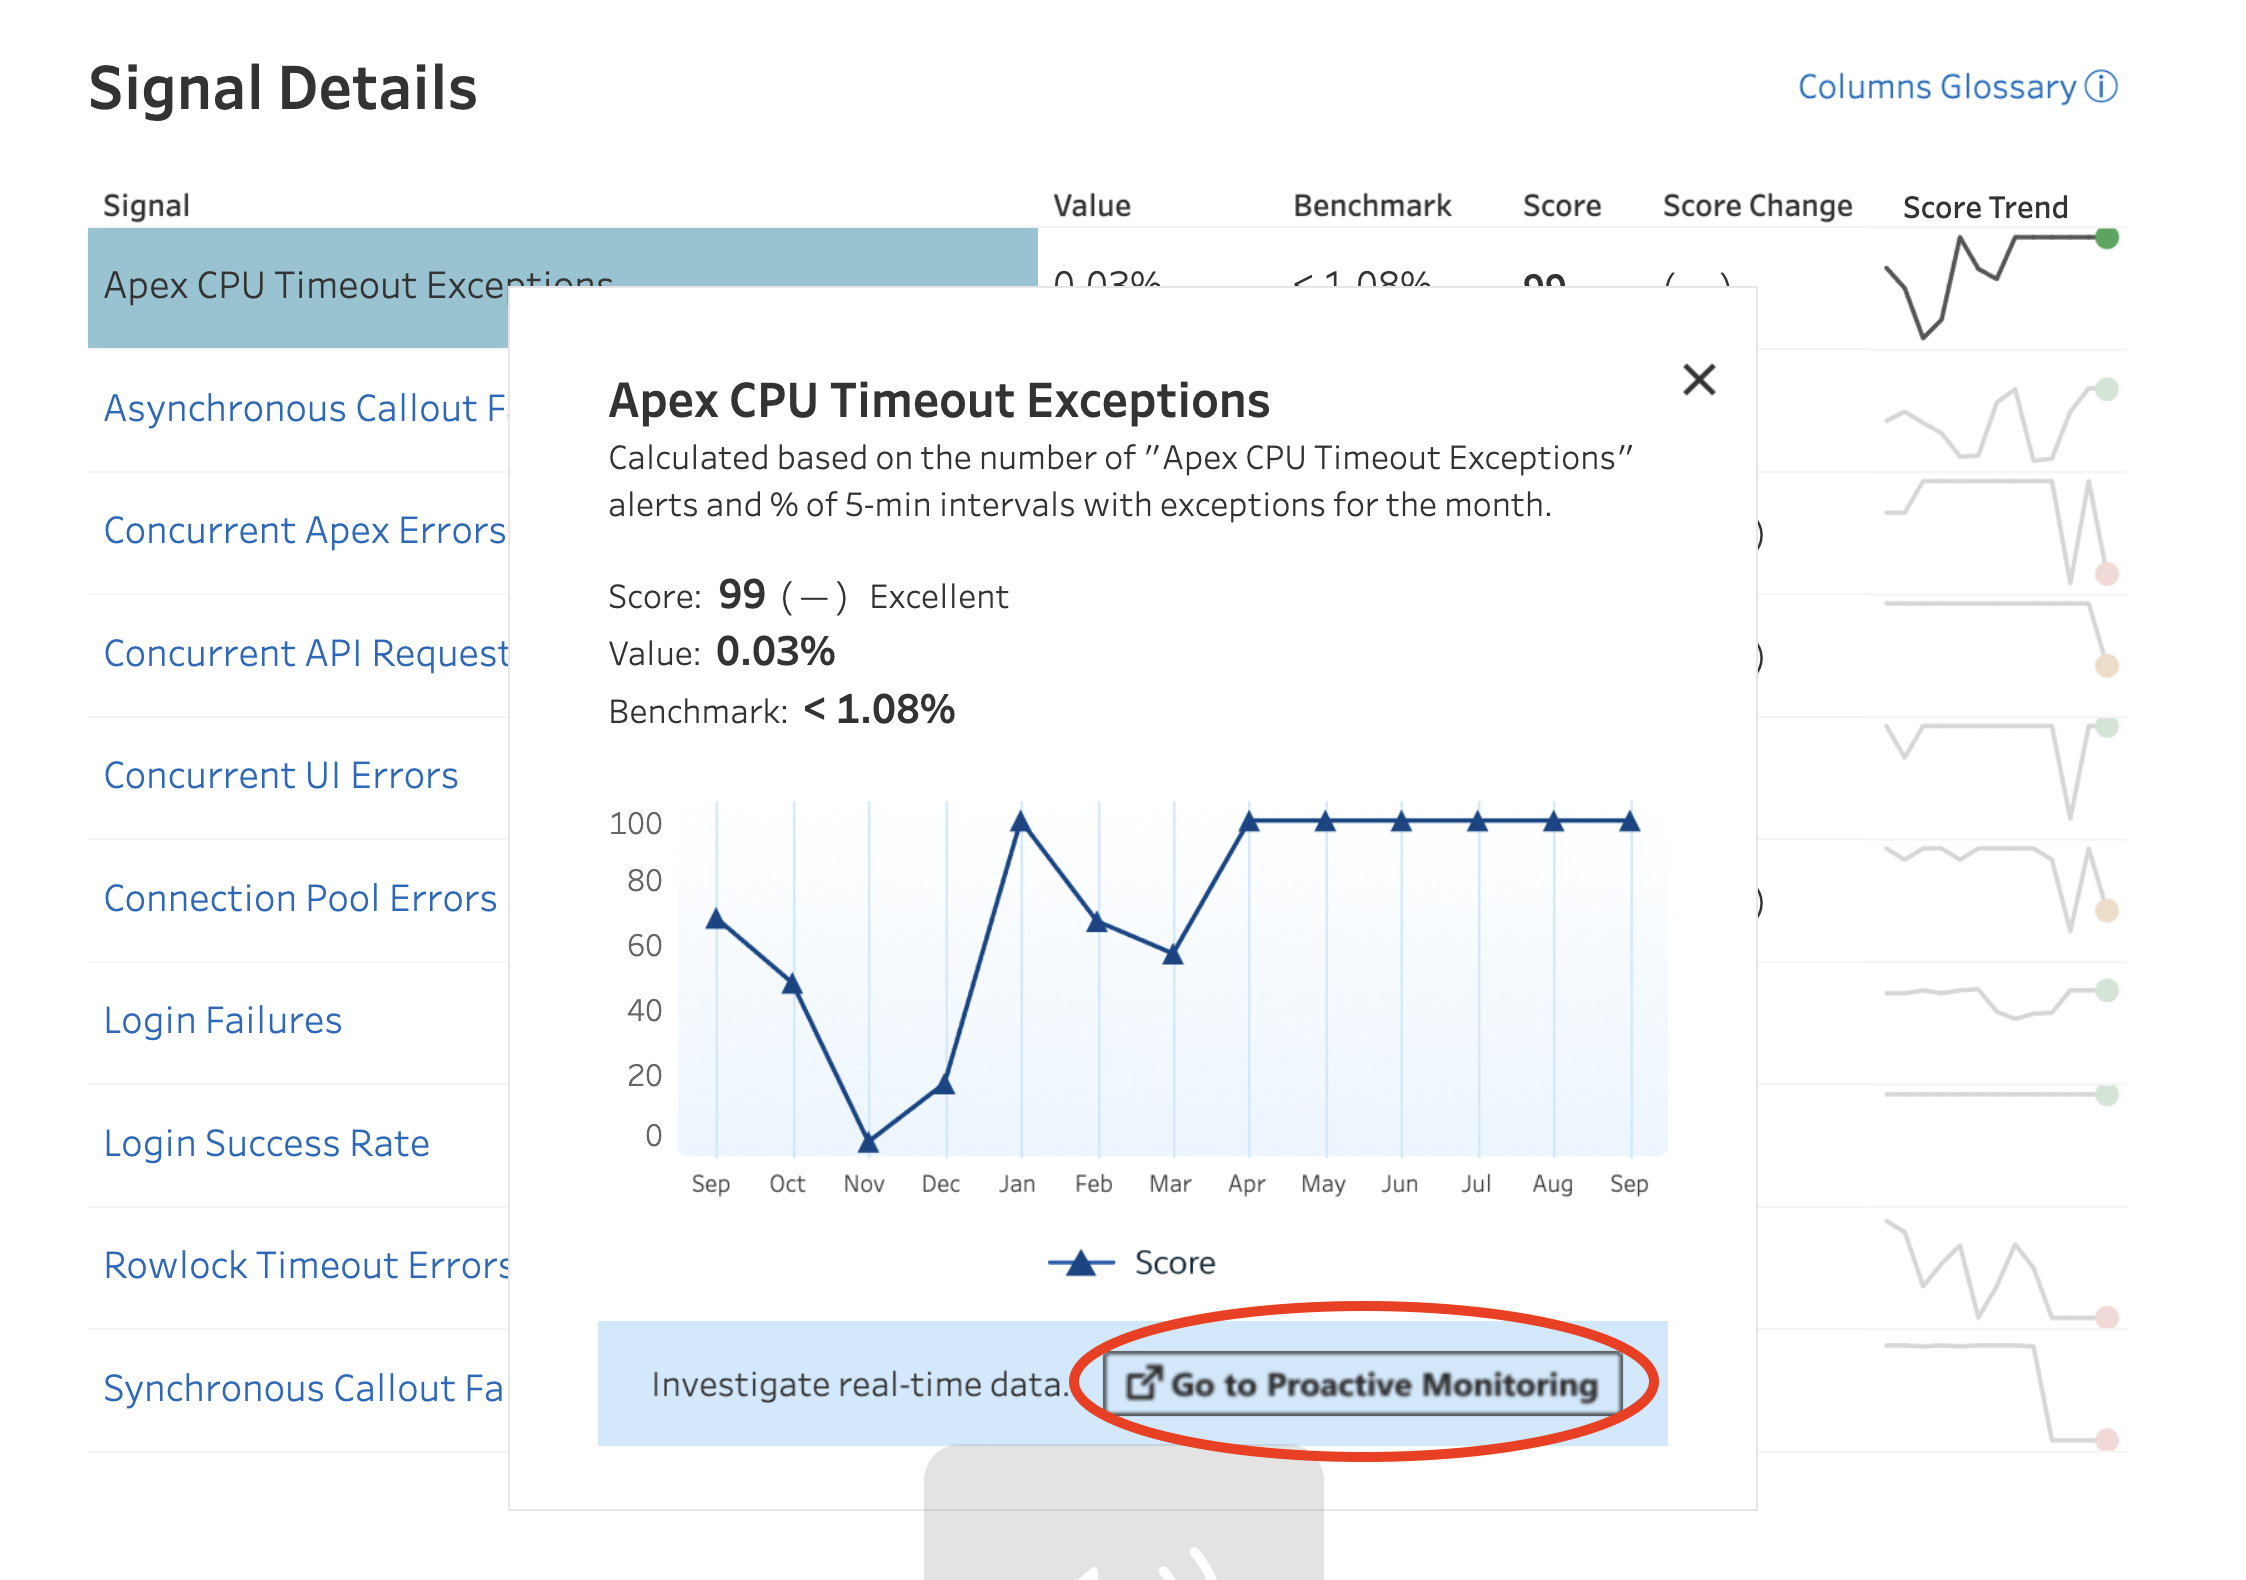
Once you are in the Signal List view in the Technical Health Section, you'll see a list of signals. There you'll be able to click on a particular signal such as ‘Apex CPU Timeout Exceptions’ as displayed in the screenshot above and be able to directly land into the Proactive Monitoring tab by clicking on Investigate with realtime metric data". By clicking here, you'll land onto the Proactive Monitoring Tab.
Here, you can review the metrics, trends, and cases associated with any Proactive Monitoring alert. Choosing the “Apex CPU Timeout Exceptions” alert will give you a trend chart like the one shown below. This will help you understand when the metric crossed warning and critical thresholds. You can customize the time and date range of data to evaluate. To gain additional insight, click on a gray or red icon on the graph.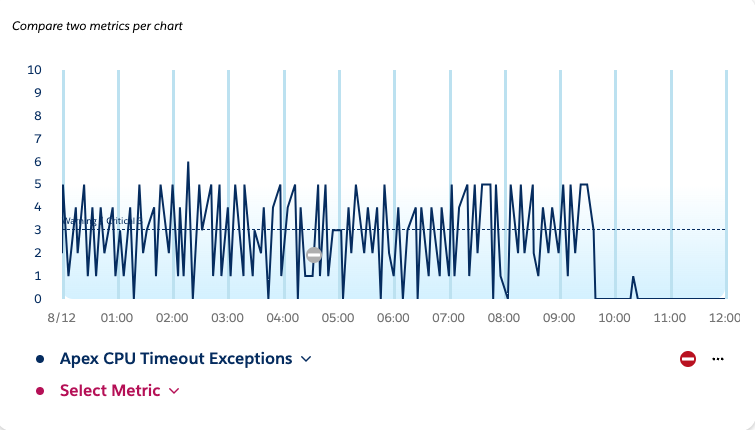
In the following example, clicking on the gray icon for the critical threshold breach will provide the information displayed in the screenshot below. You can see the lifecycle of the alert and log details from the time of the alert. This will enable you to understand the top contributing Entry Points and User IDs to investigate for the Apex CPU Timeout Exceptions alert. 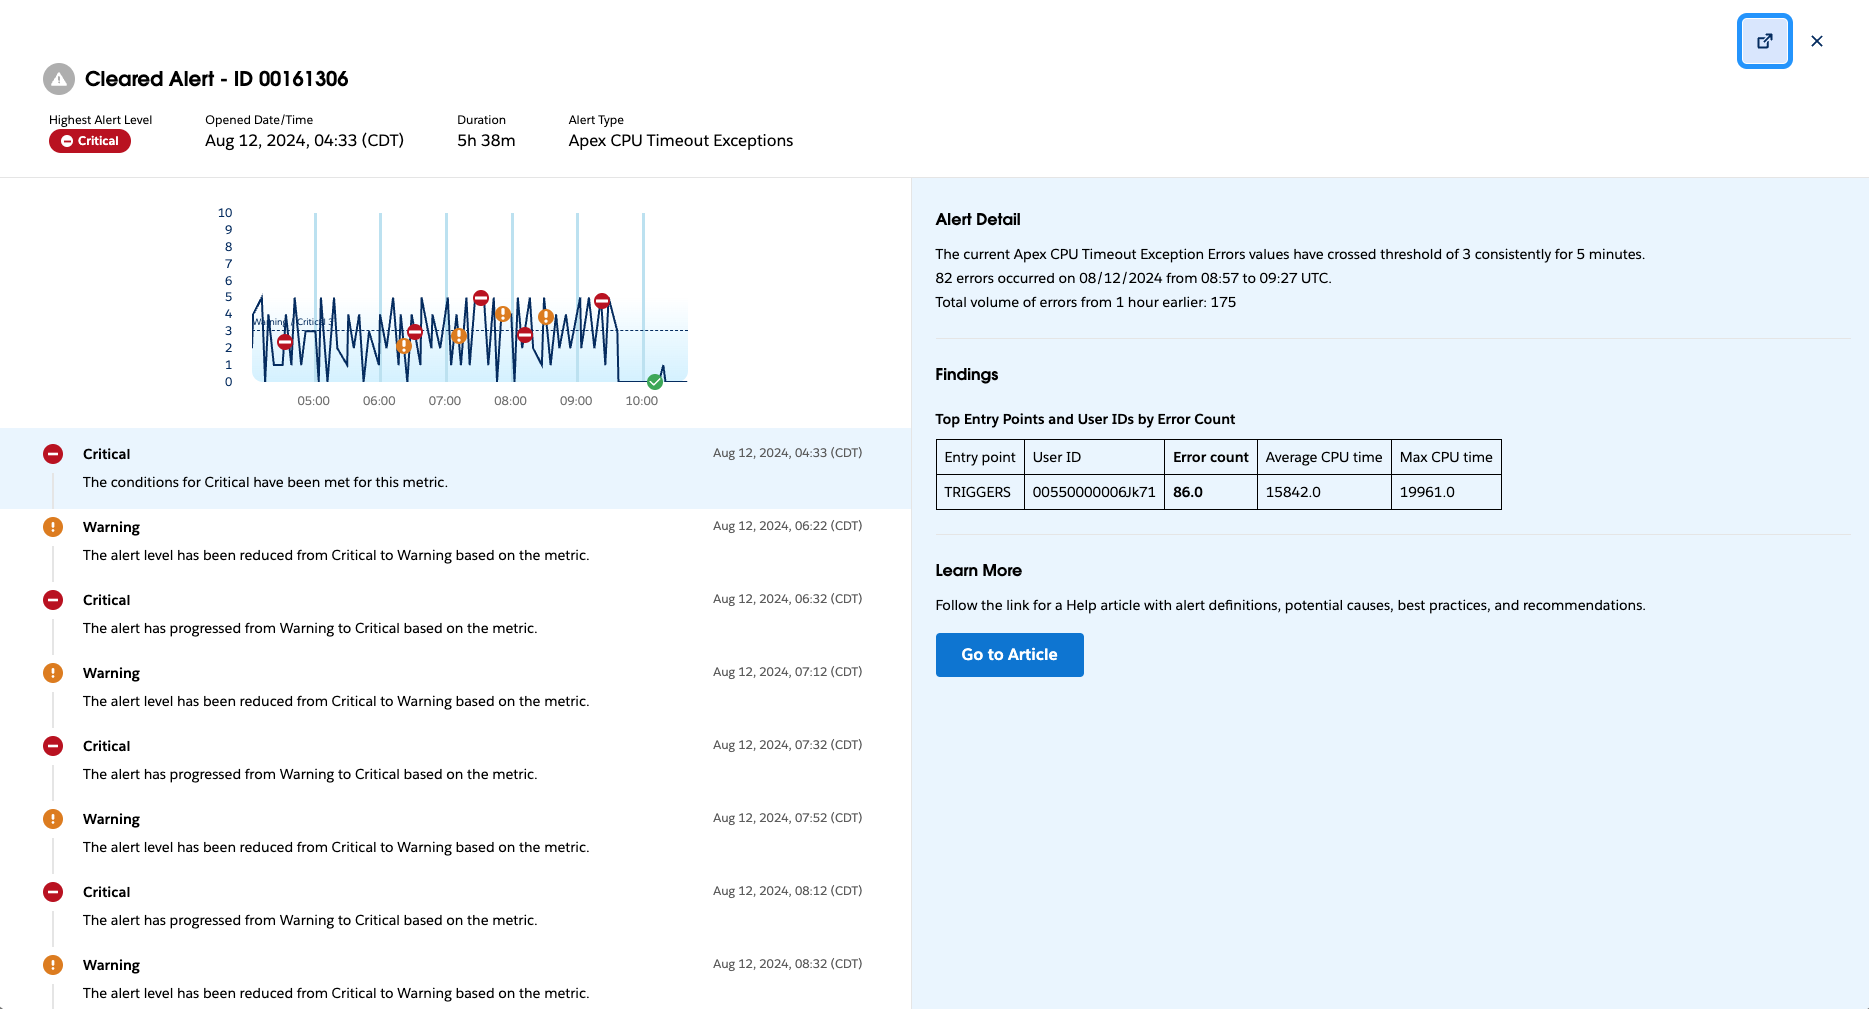
For additional details around navigation and features available within Proactive Monitoring on Help, go here.
솔루션
Use Scale Center to investigate the issue and analyze the root cause
To get more insights into the root cause of Apex CPU Time Out Errors, you can navigate to the ‘Org performance Page’ in Scale Center and select a time window for which you get these errors. You will see the Apex CPU Timeout Errors in the Total Execution Error chart shown below.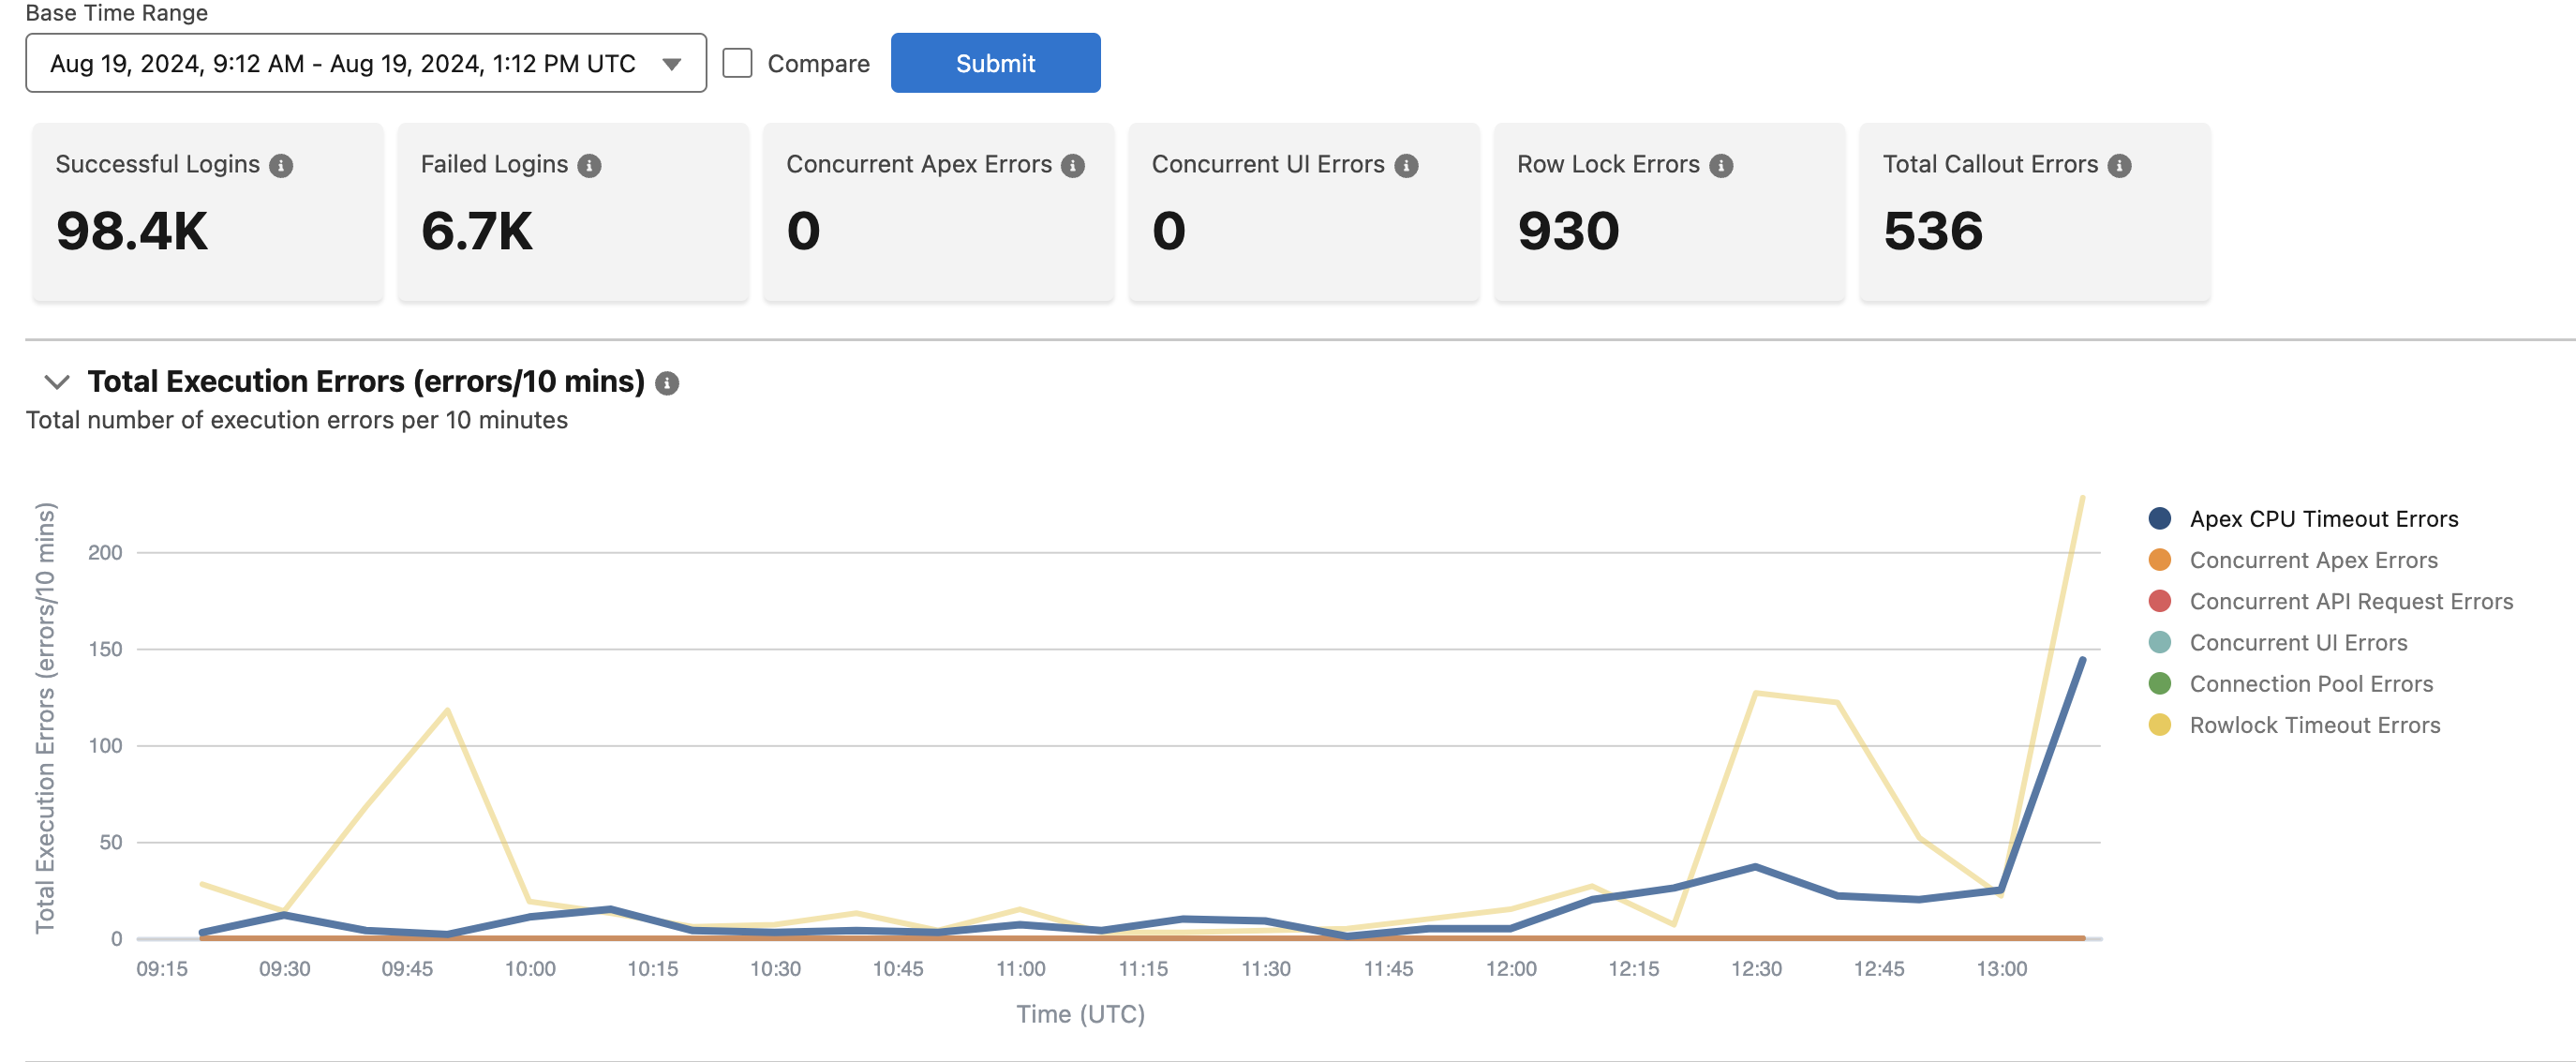
Next, you can select a spike of interest and generate the Apex Summary Analysis to root-cause the issue. 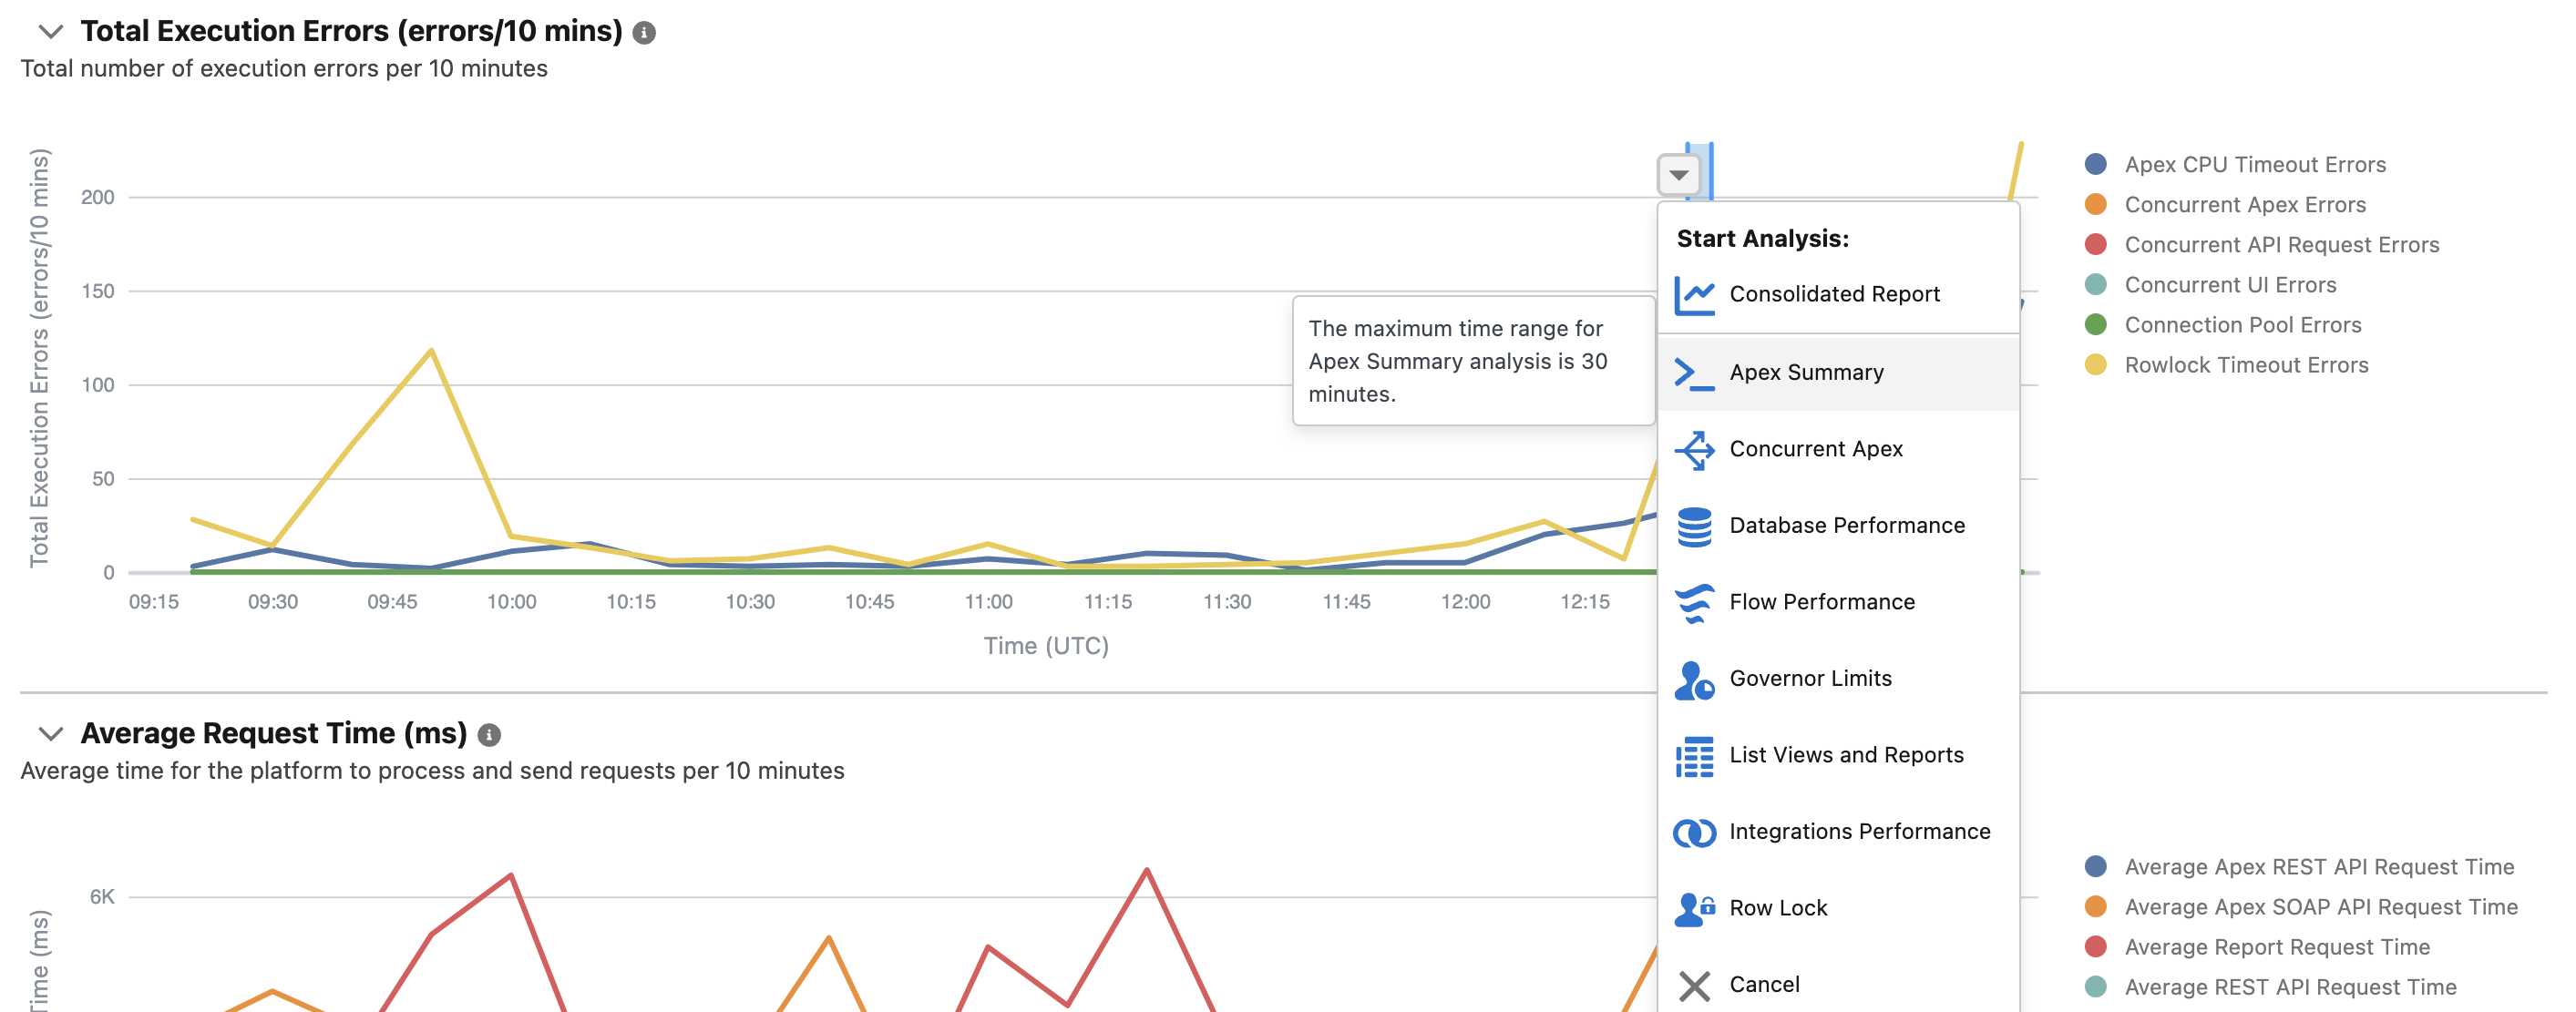
The Apex Summary Analysis provides several insights to help you root-cause this issue. The first table shows the Most Used Classes. It provides metrics on the execution count, execution times, and importantly, how many times these classes violated the five sec Governor Limit. 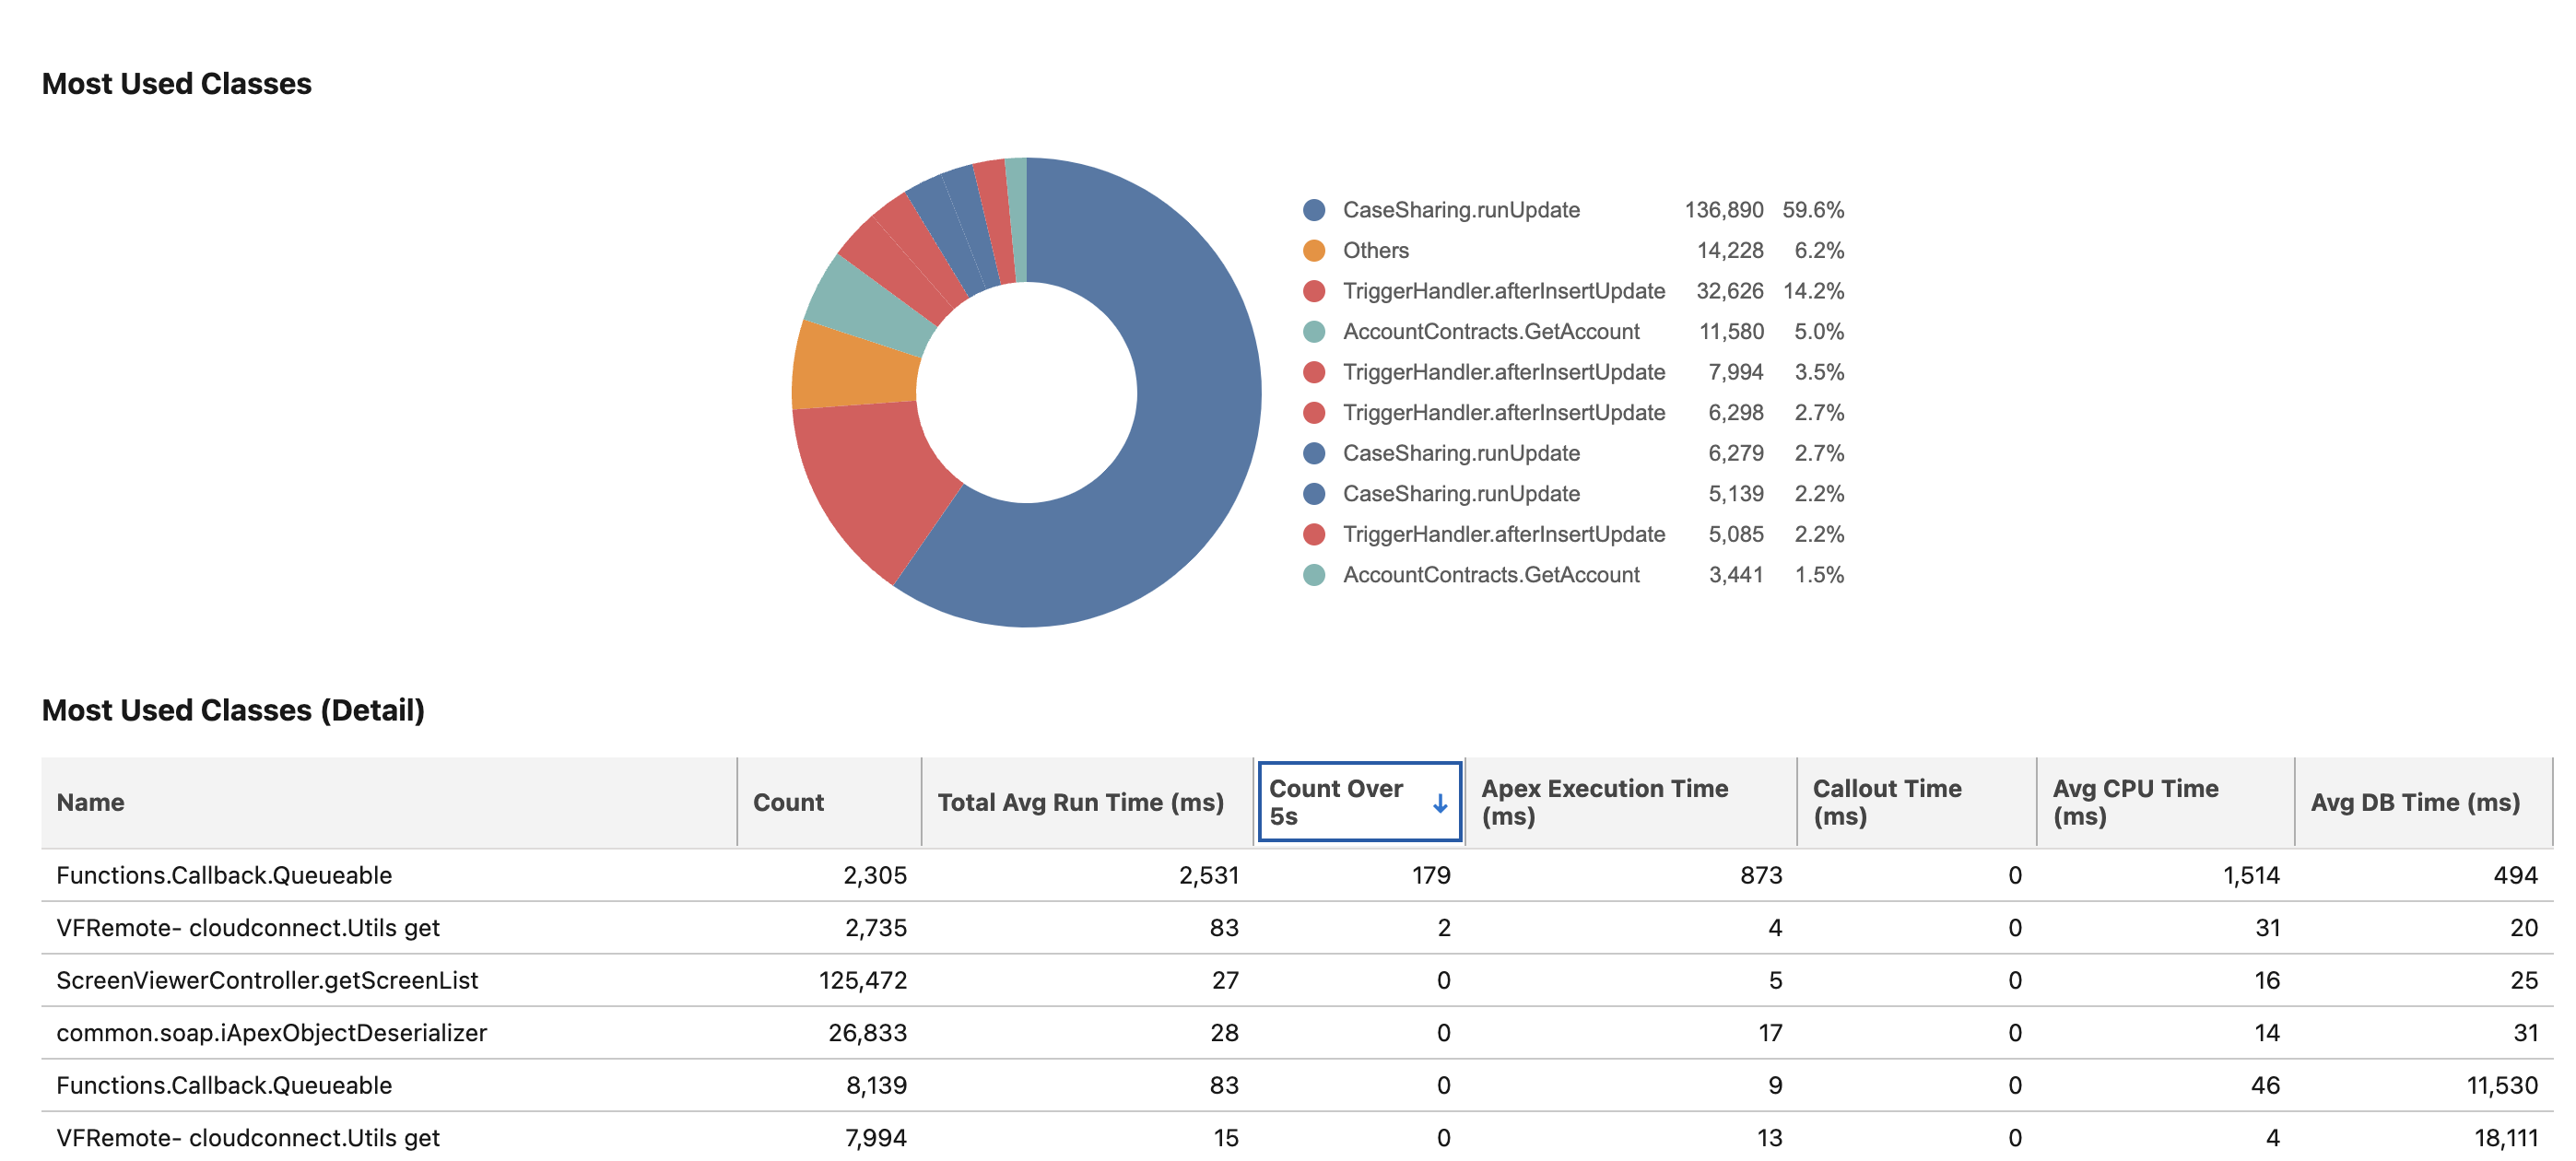
The next table in the analysis shows insights on slowest classes executed during this time interval. 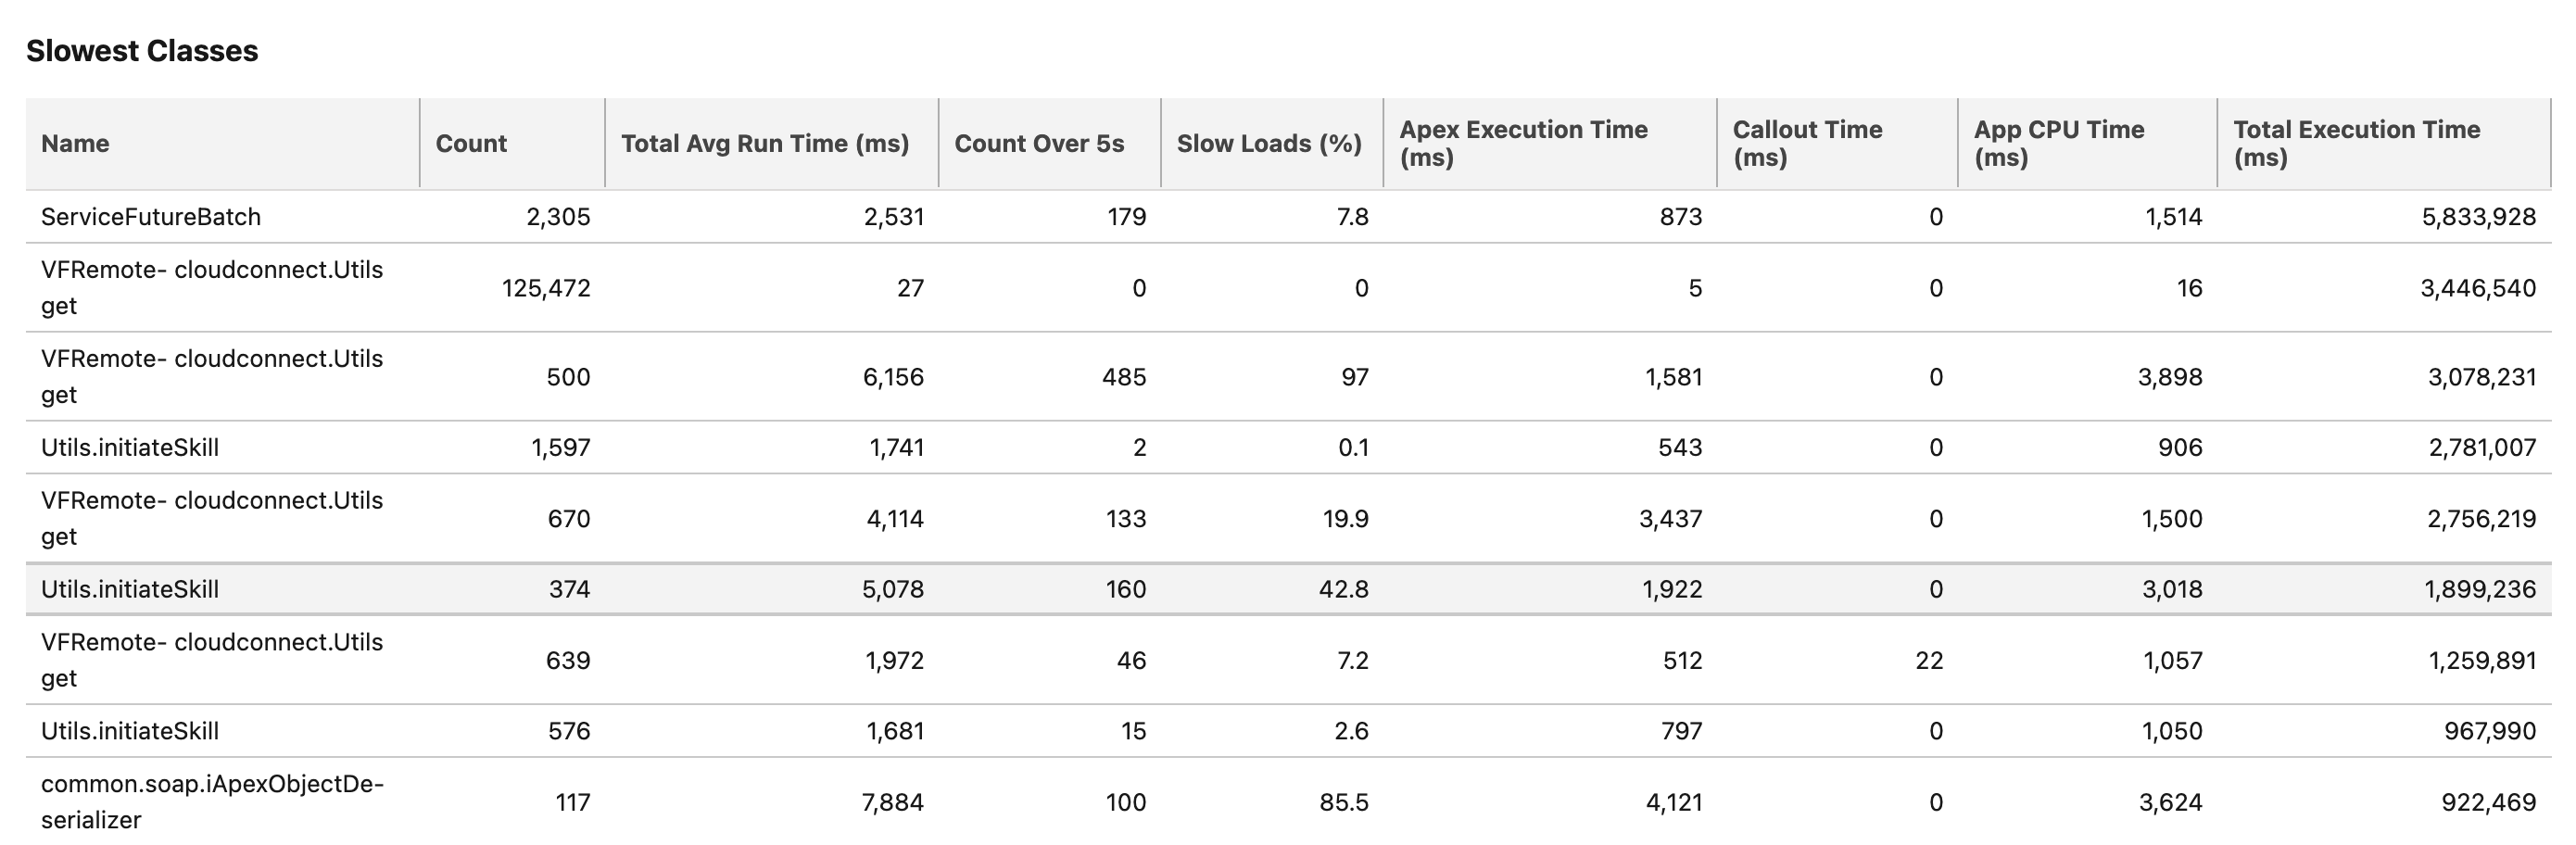
The other two tables provide insights on Long Running Asynchronous Calls and API and UI Initiated Trigger Contributors. 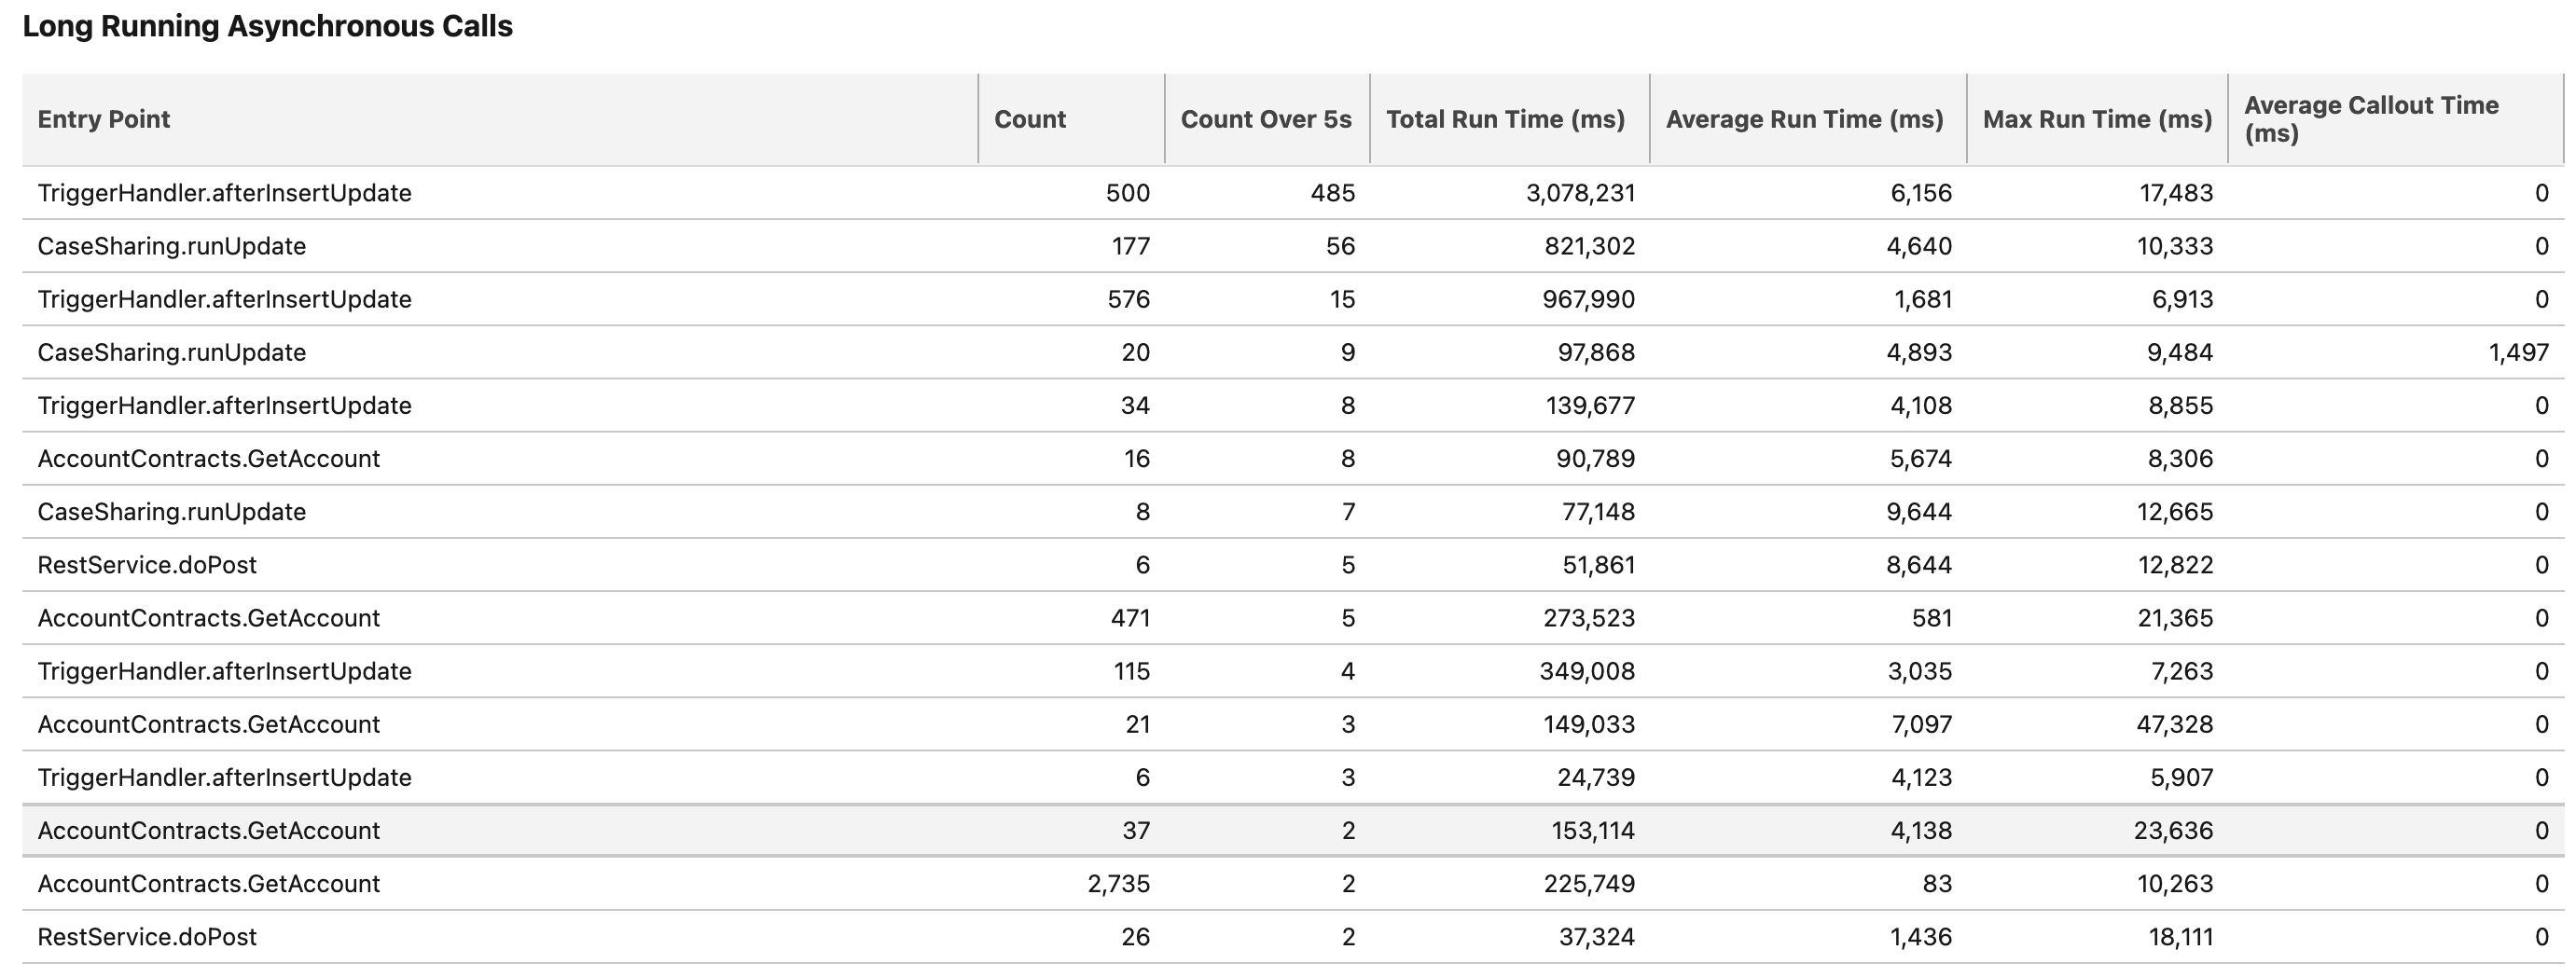
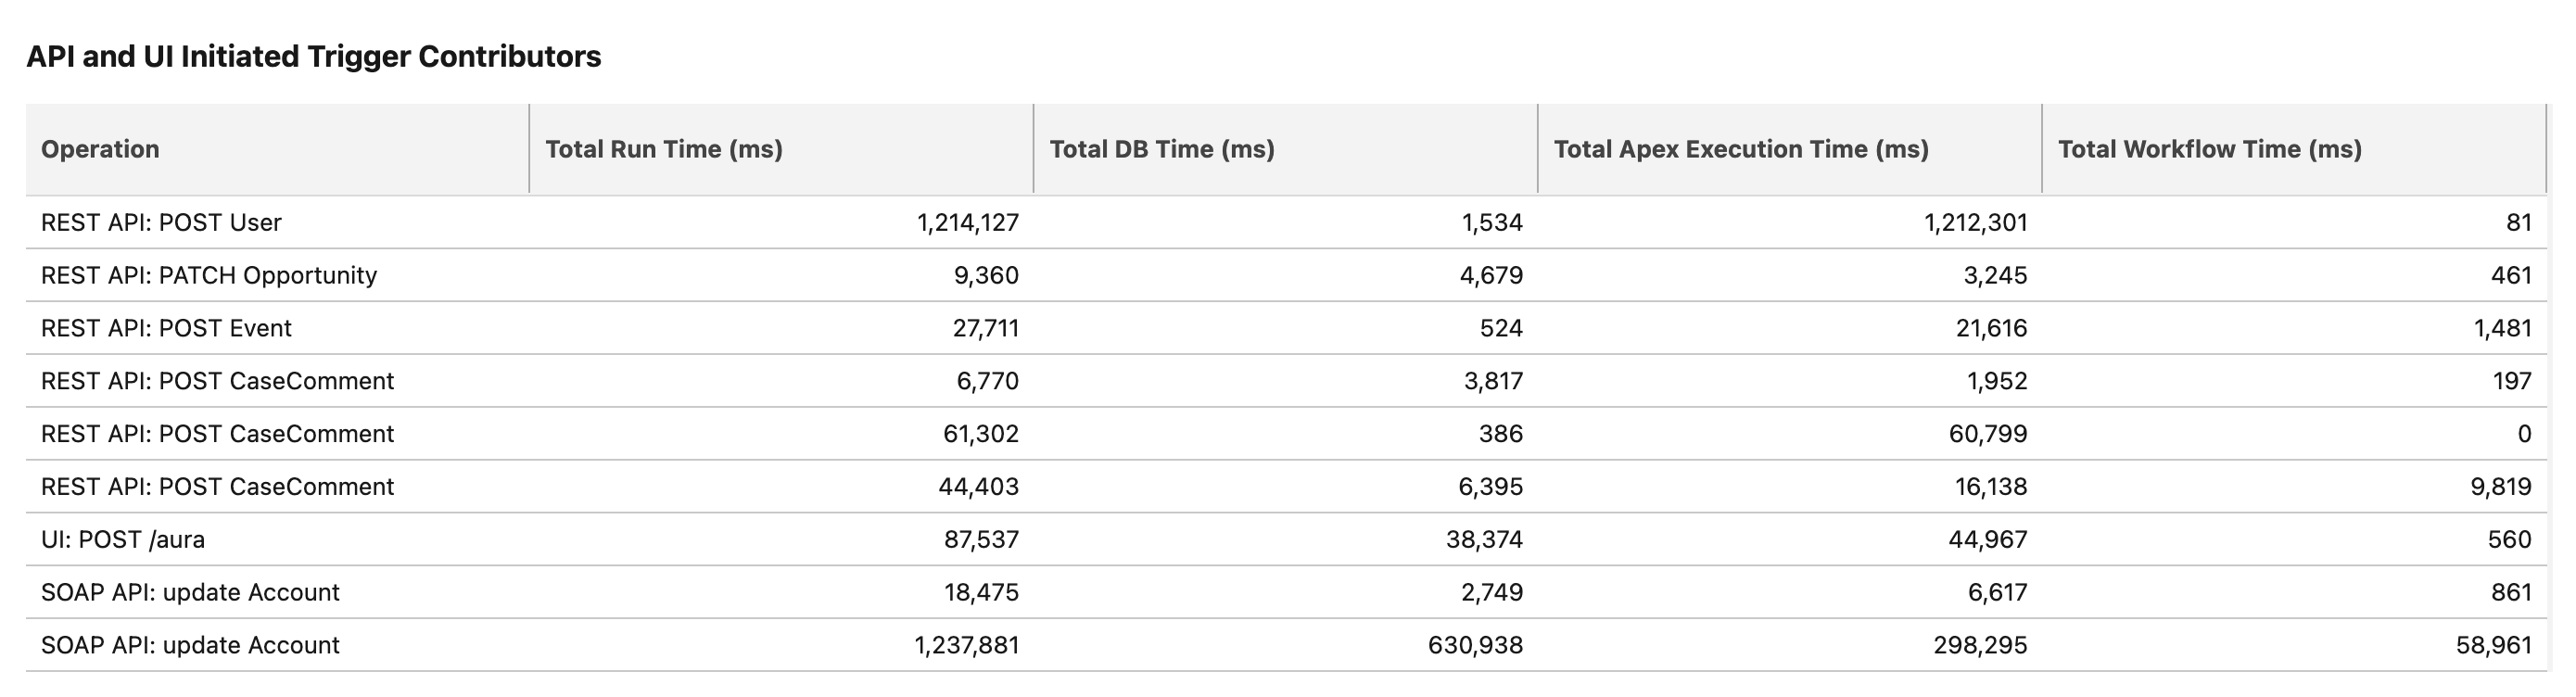
These insights from Apex Summary Analysis help you zoom into the problematic and sub-optimal areas of your Apex Implementation leading to performance bottlenecks and later Apex CPU Timeout Errors.
Best Practices to avoid these errors
Here are some common practices and resources that can help resolve this error.
Process Builder:
Where viable, convert Process Builder processes to Apex Triggers using an asynchronous approach if possible.
Managed Package involvement:
If code from a managed package (i.e. Rollup Helper) is taking part in a transaction such as Posting a Billing, you'll need to contact the authors of that package.
Custom Code:
If you have custom code (i.e. trigger), you'll need to contact your developer or responsible organization to refactor your current custom solutions to ensure you don't exceed the CPU time limit. This article includes suggested approaches to mitigate the CPU time limit exceeded issue.
Batch Processing:
If you are inserting or updating a large number of records, try reducing the batch size.
Async Apex:
Use @future calls and asynchronous processing to move non-critical business logic out of triggers and/or Process Builder processes.
Annual Technical Health Review:
Audit the Apex code you're running to ensure it's efficient. If you haven't availed of your Annual Signature ATHR, this can help in identifying where best practices aren't being followed.
Other Best Practices:
Consider Salesforce best practices for Triggers and Bulk Requests
추가 자원
Help and Developer resources:
- Code more efficiently to avoid ‘Apex CPU time Limit exceeded’
- Apex Code Best Practices
- Asynchronous Apex developer documentation
Trailhead
Knowledge 기사 번호
002888830
이 기사를 통해 문제를 해결했습니까?
개선을 위한 의견을 보내주세요.