Velg en organisasjon
Issues with Selecting and Displaying Overlapping Marks on Tableau Map
Publiseringsdato: Aug 13, 2025
Beskrivelse
When viewing a map in Tableau, you may encounter the following behaviors:
- Mark Selection: When multiple marks exist at the exact same location, only the topmost mark can be selected with a direct click. The criteria for which mark is selected first is unclear.
- Polygon Color: A specific geographic area (polygon) may appear in a darker color compared to its originally set color or to surrounding areas.
- Varying Color Intensity: When a dimension is added to the sheet such as Detail shelf, the color intensity of a polygon may vary depending on the number of records it contains; areas with more records appear darker.
Example
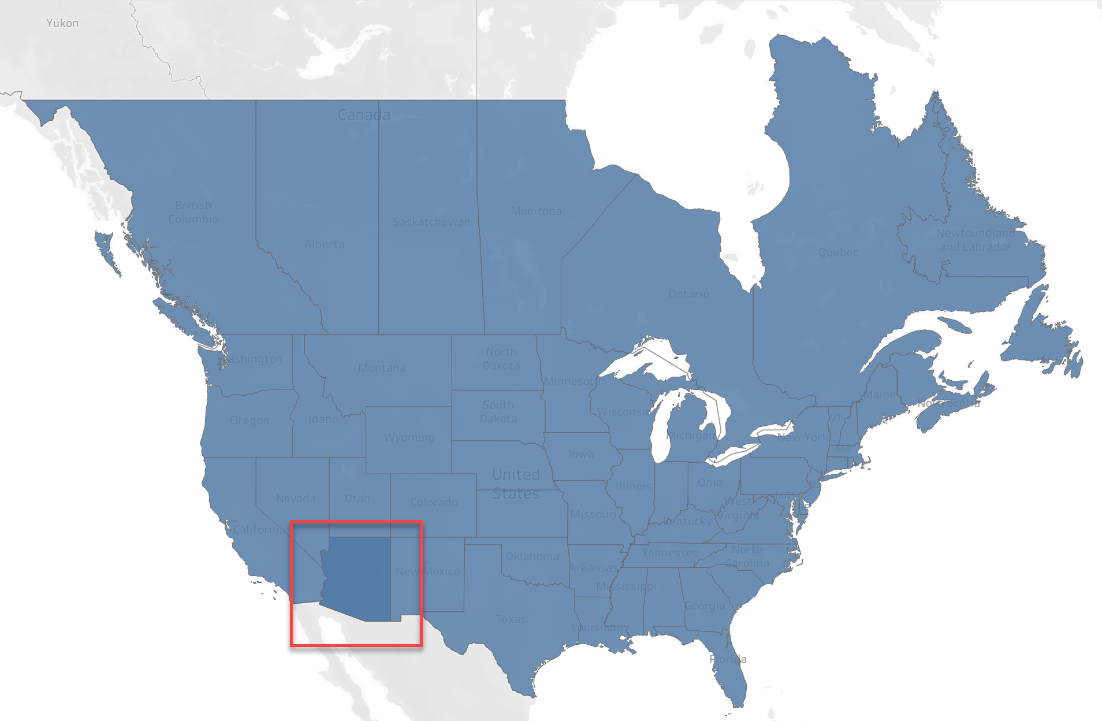
One state is shown in a different shade unexpectedly:
Løsning
These issues are caused by multiple marks being drawn on top of each other. The resolution is either to prevent the marks from overlapping or to control the stacking order to bring the desired mark to the top.
Workaround
- In Case of Overlapping
To resolve issues of unintended darker colors and to consolidate marks, use one of the following options to prevent overlapping.
- Option 1: Unify Dimension Members
For example, "Arizona" "Ariz." and "AZ" all refer to the same geographic location, but if their names differ in the data, they may overlap on the map. To avoid this, make sure to unify them under a single, consistent name.
-
- Unify Dimension Members in the Data Source If the issue is caused by duplicate geographical names in the data, clean the source data to use a single, consistent name.
- Unify Dimension Members Using a Calculated Field Create a calculated field to standardize the names using a formula.
For example, create a calculated field to unify "Arizona" "Ariz." and "AZ" into "Arizona":
IF [Geographic Dimension] = "Ariz." THEN "Arizona"
ELSEIF [Geographic Dimension] = "AZ" THEN "Arizona"
ELSE [Geographic Dimension]
END
- Option 2: Adjust the Level of Detail
If the issue is caused by an unnecessary dimension on the Detail shelf, remove that dimension from the Marks card for the relevant layer.
- In Case of Controlling The Stacking Order
To control which mark appears on top and is therefore selectable, use the following method.
- Control the Draw Order with Sorting The mark that appears on top is determined by the sort order. To change which mark is on top, adjust the sort order of the dimensions on the Marks card. This can be done by:
1. Rearranging the order of the dimension pills on the Marks card (topmost is evaluated first).
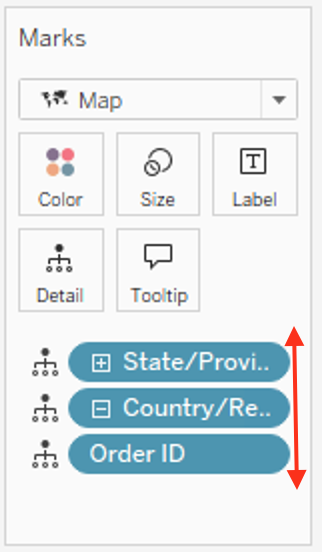
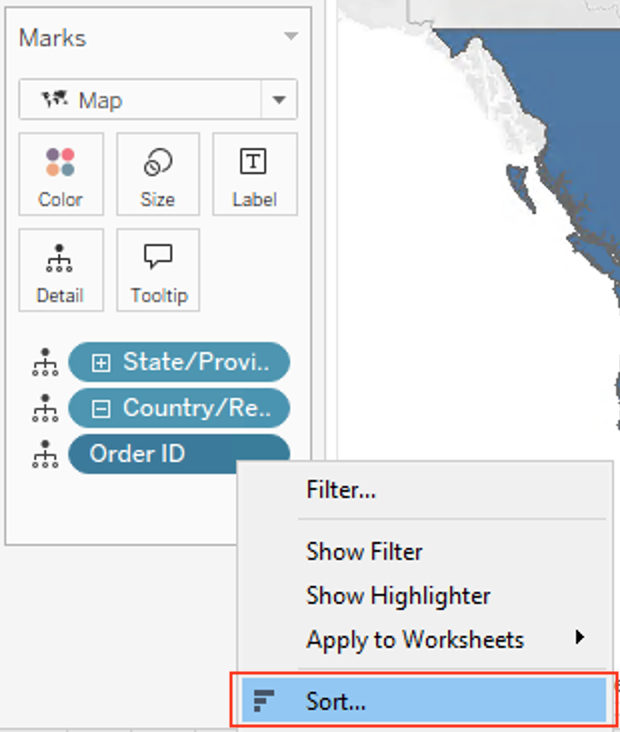
2. Changing the sort settings of the dimension field itself (e.g., from Ascending to Descending).
Flere ressurser
This behavior occurs because Tableau renders a mark for each row in the data that corresponds to the view's level of detail. If multiple rows of data define the same mark (e.g., the same coordinates or polygon shape), Tableau will draw a mark for each row, stacking them on top of one another.
- Draw Order (Z-Order): The order in which marks are stacked is determined by the sort order of the dimensions on the Marks card (excluding Tooltip), evaluated from top to bottom. The sort order for each dimension's members follows the configuration for that field (by default, this is ascending order based on the data source). The topmost mark in this order is the one that is selectable by a direct click.
- Click Selection: To select all overlapping marks simultaneously, use the rectangular or lasso selection tools.
- Color Blending: When identical, semi-transparent polygons are stacked, their colors combine, creating a darker appearance. This is standard graphic rendering behavior.
Knowledge-artikkelnummer
004577012
Hjalp denne artikkelen med å løse problemet ditt?
La oss få vite det slik at vi kan forbedre!