Sélectionner une organisation
Proactive Monitoring on Help: Knowing when & how to modify your alert configurations
Date de publication: Jun 24, 2026
Description
Proactive Monitoring uses thresholds to define when you are alerted. Before we dive deeper into understanding how and when to modify your configurations, there are some important concepts to get a handle on. Generally speaking thresholds are broken down into two types :: Percentage based thresholds & volume + duration based thresholds. Below you’ll find a brief description of each to help you when identifying what to change and when.
Percentage based thresholds:
These are thresholds typically used on our Limit style alerts, where you have a certain amount of activity that can be conducted within a period of time before processes may be stopped (total API requests per day, for example). Here we use the % of consumption against the total limit (0→100%) to determine the threshold for alerting.
Volume & Duration based thresholds:
This is typically the formula we leverage for our Error and Performance based alerts, where we will look for sustained activity over a set period of time to determine the severity of the alert. Each severity has 2 values:
- The threshold identifies the volume aspect, how many errors/runtime in milliseconds needs to be met
- The duration identifies how long, in minutes, the threshold needs to be sustained for before alerting
Keep in mind: Some alerts leverage AI Machine Learning models to evaluate performance for anomalies. These cannot be updated via self-service & the UI should reflect the same.
Scenario 1: When to activate an alert
There can be many scenarios which warrant activation of monitoring in a new area for your environment. We’ve outline some examples below to help!
- Go Live introducing new functionality
- Metrics trending in the wrong direction
- Unforeseen high severity issue
- Periodic review of trends
Go Live:
When evaluating what to activate, it’s always best to start with our monitoring catalog. The catalog contains an outline of what we can monitor along with descriptions of each. This is a good place to start to understand if the monitoring needs align with the current offering.
- Each of the monitors typically aligns to the name of a product/feature/exception thrown. If you know you’ll be expanding usage of Platform Events or will be rolling out Service Cloud Voice, you should easily be able to match up to the monitor in the catalog.
Metrics trending in the wrong direction:
High, or upward trending, consumption on a metric can be an indicator of inefficiencies in that area. “High” is also subjective from one business to another, which can impact how you evaluate the thresholds from one monitor to the next (see section below on threshold management).
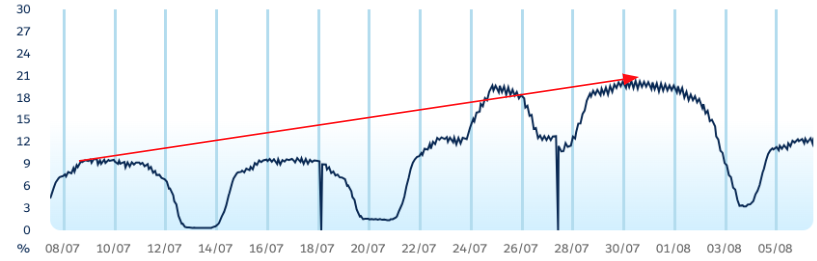
By way of example, lets review the below graph which is tracking % of consumption against a limit. On paper this looks good, we see the majority of activity during the week, with drops over weekends when the business is quieter. Current consumption is hovering around 20% at its peak, indicating plenty of room to grow. They key is noticing the trend from month beginning → end. Having 2x’d the consumption, this trend may continue upward. It’s worth monitoring over time OR switching on the alert associated with the metric. Alerts wont start triggering right away but if consumption continues to increase, I can be alerted once default thresholds are met as opposed to monitoring periodically in an eyes on glass fashion.
Unforeseen Issues:
Things don’t always go to plan & unforeseen incidents can crop up without warning. During your retro activities, reviewing your currently configured alerts against the broader catalog may highlight opportunities for expanded monitoring in areas that were highlighted as impactful during the incident:
- Certain error types not previously monitored
- A limit which was hit but previously didnt have monitoring active
Periodic review of trends:
Overall, it is generally good practice to periodically check back in on your trends to identify new opportunities for updating your monitoring configurations.
Scenario 2: Threshold Management
Modifying thresholds isn’t an exact science. The changes made will differ from one environment to the next and will depend on the business appetite for risk and/or how impactful the breach of a limit or high volumes of errors can be to your environment. Below we’ve outlined a sample scenario where we would typically recommend threshold adjustments, as well as how we might go about defining those changes.
- Scenario: “Business is indicating volume of alerts attributed to Rowlock Timeout errors is too high. Whilst the insight from alerts is valuable, the current volume is not business stopping and there is a backlog item open to have someone review the operations causing problems.”
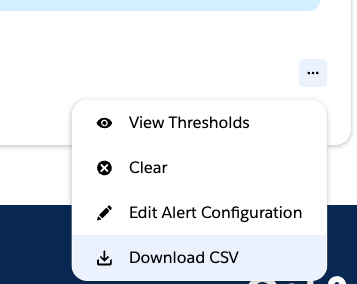
- Step 1: Log in to Proactive Monitoring on Help and review recent telemetry for the metric in question (expanding to the 30 day view can help)
- Step 2: Identify hot spots or trends in consumption that coincide with alerts
- Step 3: Review the currently configured thresholds in the “Config” tab & take note of both the threshold AND duration
- Step 4: An easy way to find new thresholds would be to take an export of the data from the past month
- Once downloaded, identify the average volume by aggregating the daily counts + averaging the totals
- This result can be considered the daily baseline for your org, accounting for the lows and highs.
- Compare this to your currently configured thresholds:
- IF the average is LOWER than the threshold, it could indicate your environment suffers from spikes in errors, as opposed to sustained volume over time. Increasing the “Duration” value may help here, effectively telling the system to consider longer periods where the threshold is breached before alerting.
- IF the average is HIGHER than the currently configured threshold, consider setting the Warning threshold to the average, and adjusting the Critical threshold to a new value 10/20% higher than the average
- Overall each change tells the system to consider larger volumes of errors which should then address the feedback from the scenario above, reducing the no. of times you’re alerted without eliminating monitoring of the problem area.
-
Ressources supplémentaires
Additional Essential Information
- It may take some trial and error before finding the right levels to meet the needs of your organization. Iterating through different threshold values can be a natural part of finding what works best for you.
- Keep an eye on the Update Pending status after saving a change, until this clears the new thresholds won’t take effect.
- Where applicable, modifying the Duration can sometimes be more effective especially for Performance monitoring. It’s a good mechanism for ensuring there was sustained activity as opposed to a quick event which may have self resolved.
Numéro d’article de la base de connaissances
005185022
Cet article a-t-il résolu votre problème ?
Dites-nous ce que nous pouvons améliorer !