Выбрать организацию
Calculate the percentage of Subtotals in a Salesforce Report
Дата публикации: May 5, 2026
Описание
This article explains how to create an Opportunity Report that displays the percentage of Opportunities by Stage, helping the Sales team and management quickly understand the pipeline distribution.
Решение
Step 1: Create a Report
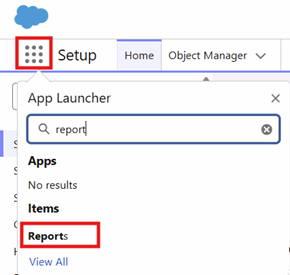
- Click on the App Launcher in the top-left corner of your screen and type Reports and select the Reports option
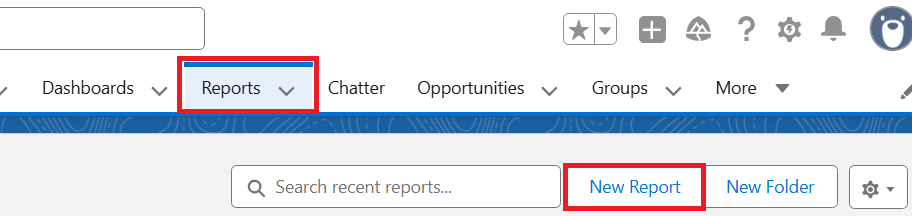
- Under the Reports tab, click the New Report button to start creating a Report
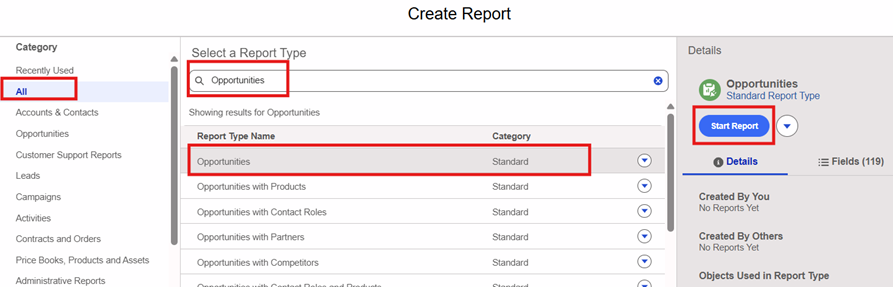
- Under All Category, search for the Opportunities Standard Report Type, select the Opportunities Report Type, and click the Start Report button to begin creating the Report
Step 2: Define Report Filter criteria
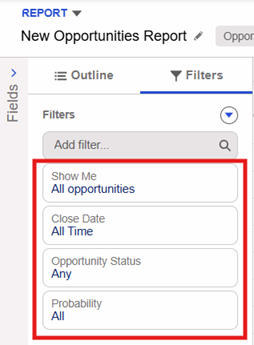
- Click the Filters tab in the left pane to set the filters to display all Opportunities with all Stages and Close Dates visible
- Now, click the Outline tab next to the Filters tab to add Row groupings and Columns to be displayed in the Opportunities Report
- Under the Group Rows section, search and add the Stage field
- Under the Group Columns section, add the fields that you need to have in the Report. In this use case, we have selected Opportunity Name, Account Name, Amount and Close Date
- Keep all the toggles at the bottom of the Report to view Record Counts, Detail Rows, Subtotals and Grand Total

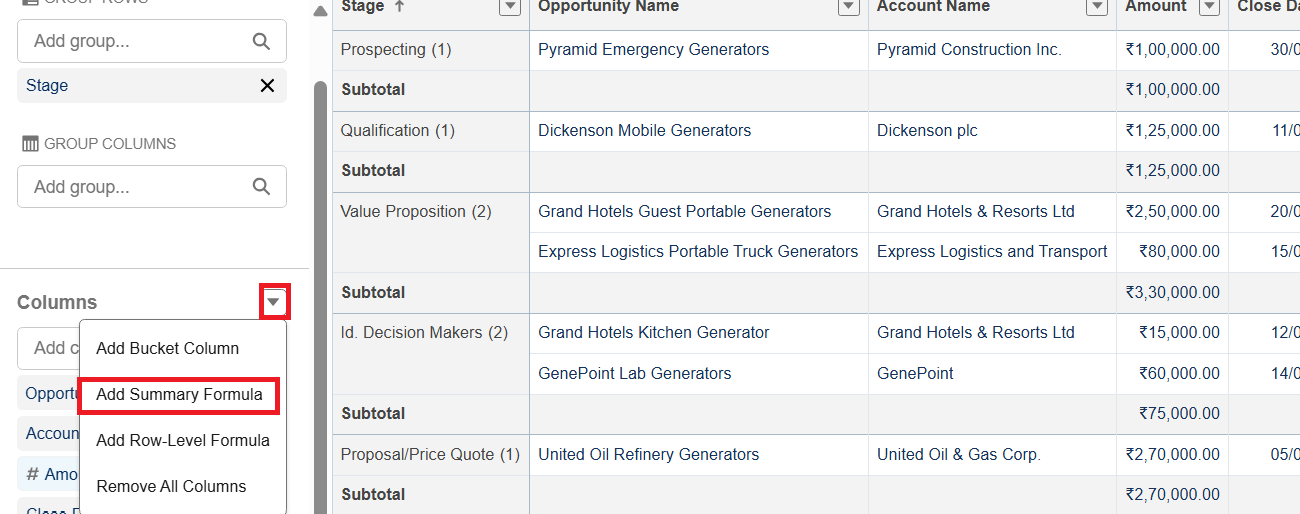
Step 3: Create a Summary Formula
- Now, create a Summary Formula by clicking on the downward arrow next to the Columns section and select the Add Summary Formula option
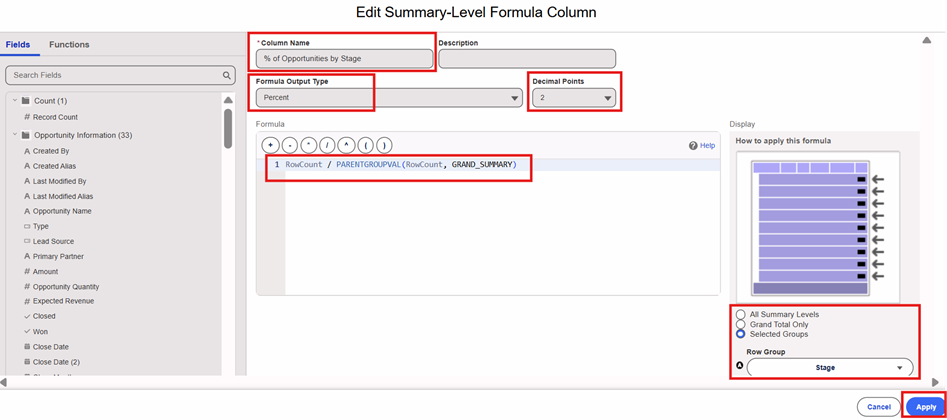
- Provide a suitable Name for the Summary-Level Formula field along with the other information as:
| Column Name | % of Opportunities by Stage |
| Formula Output Type | Percent |
| Decimal Points | 2 |
| Formula | |
- Under the Display section on the right side of the screen, click the Selected Groups radio button
- Under Row Group, select the Stage field and click the Apply button to save the Summary-Level Formula field
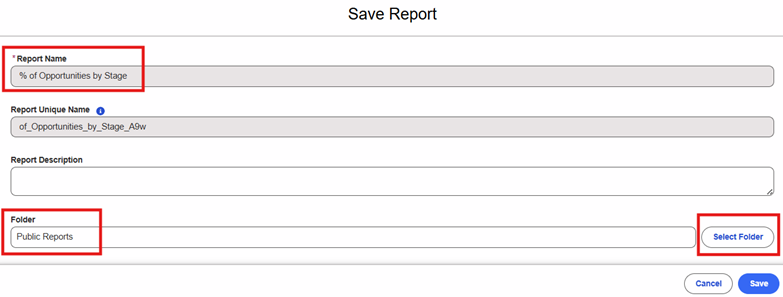
Step 4: Save and Run the Report
- Finally, click Save & Run to Save and Run the Report
- Provide a proper Report Name, along with the location of the Report by clicking on the Select Folder button. Once the Name and Folder selection is completed, hit the Save button
Step 5: Review the output
- The output of the Report will look like the one shown below
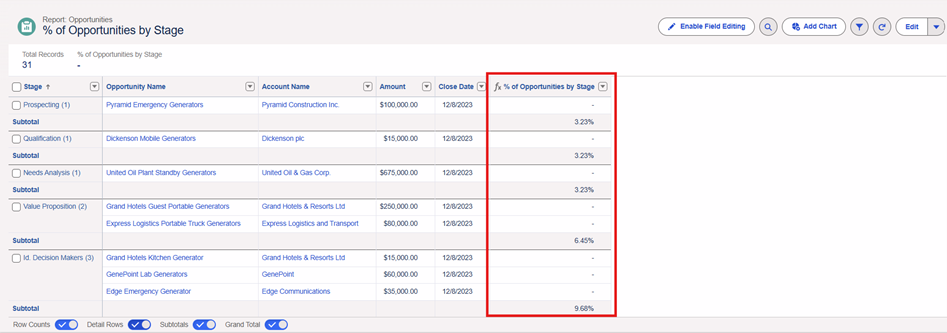
Note: In case you want to hide the Detail Rows to only see the percentage of Opportunities count by Stage, toggle off the Detail Rows option at the bottom of the Report
Дополнительные ресурсы
Add a Summary Formula Column to a Report
Номер статьи базы знаний
005306446
Эта статья решила вашу проблему?
Оставьте свой отзыв, чтобы мы могли стать лучше!