조직 선택
How to Implement Linear Interpolation with Sparse Data in Tableau
게시 일자: Jul 29, 2026
전제 조건
과업
Take the following dataset as an example.
| Dimension | Measure |
| A | 100 |
| B | 200 |
| C | |
| D | 150 |
| E | 600 |
| F | |
| G | |
| H | 400 |
| I | 200 |
| J | |
| K | |
| L | |
| M | 250 |
| N | 500 |
| O | 1000 |
Because this dataset has missing values along a discrete dimension, a standard line chart will fail to render smoothly—either breaking into disconnected segments or dropping inaccurately to zero.
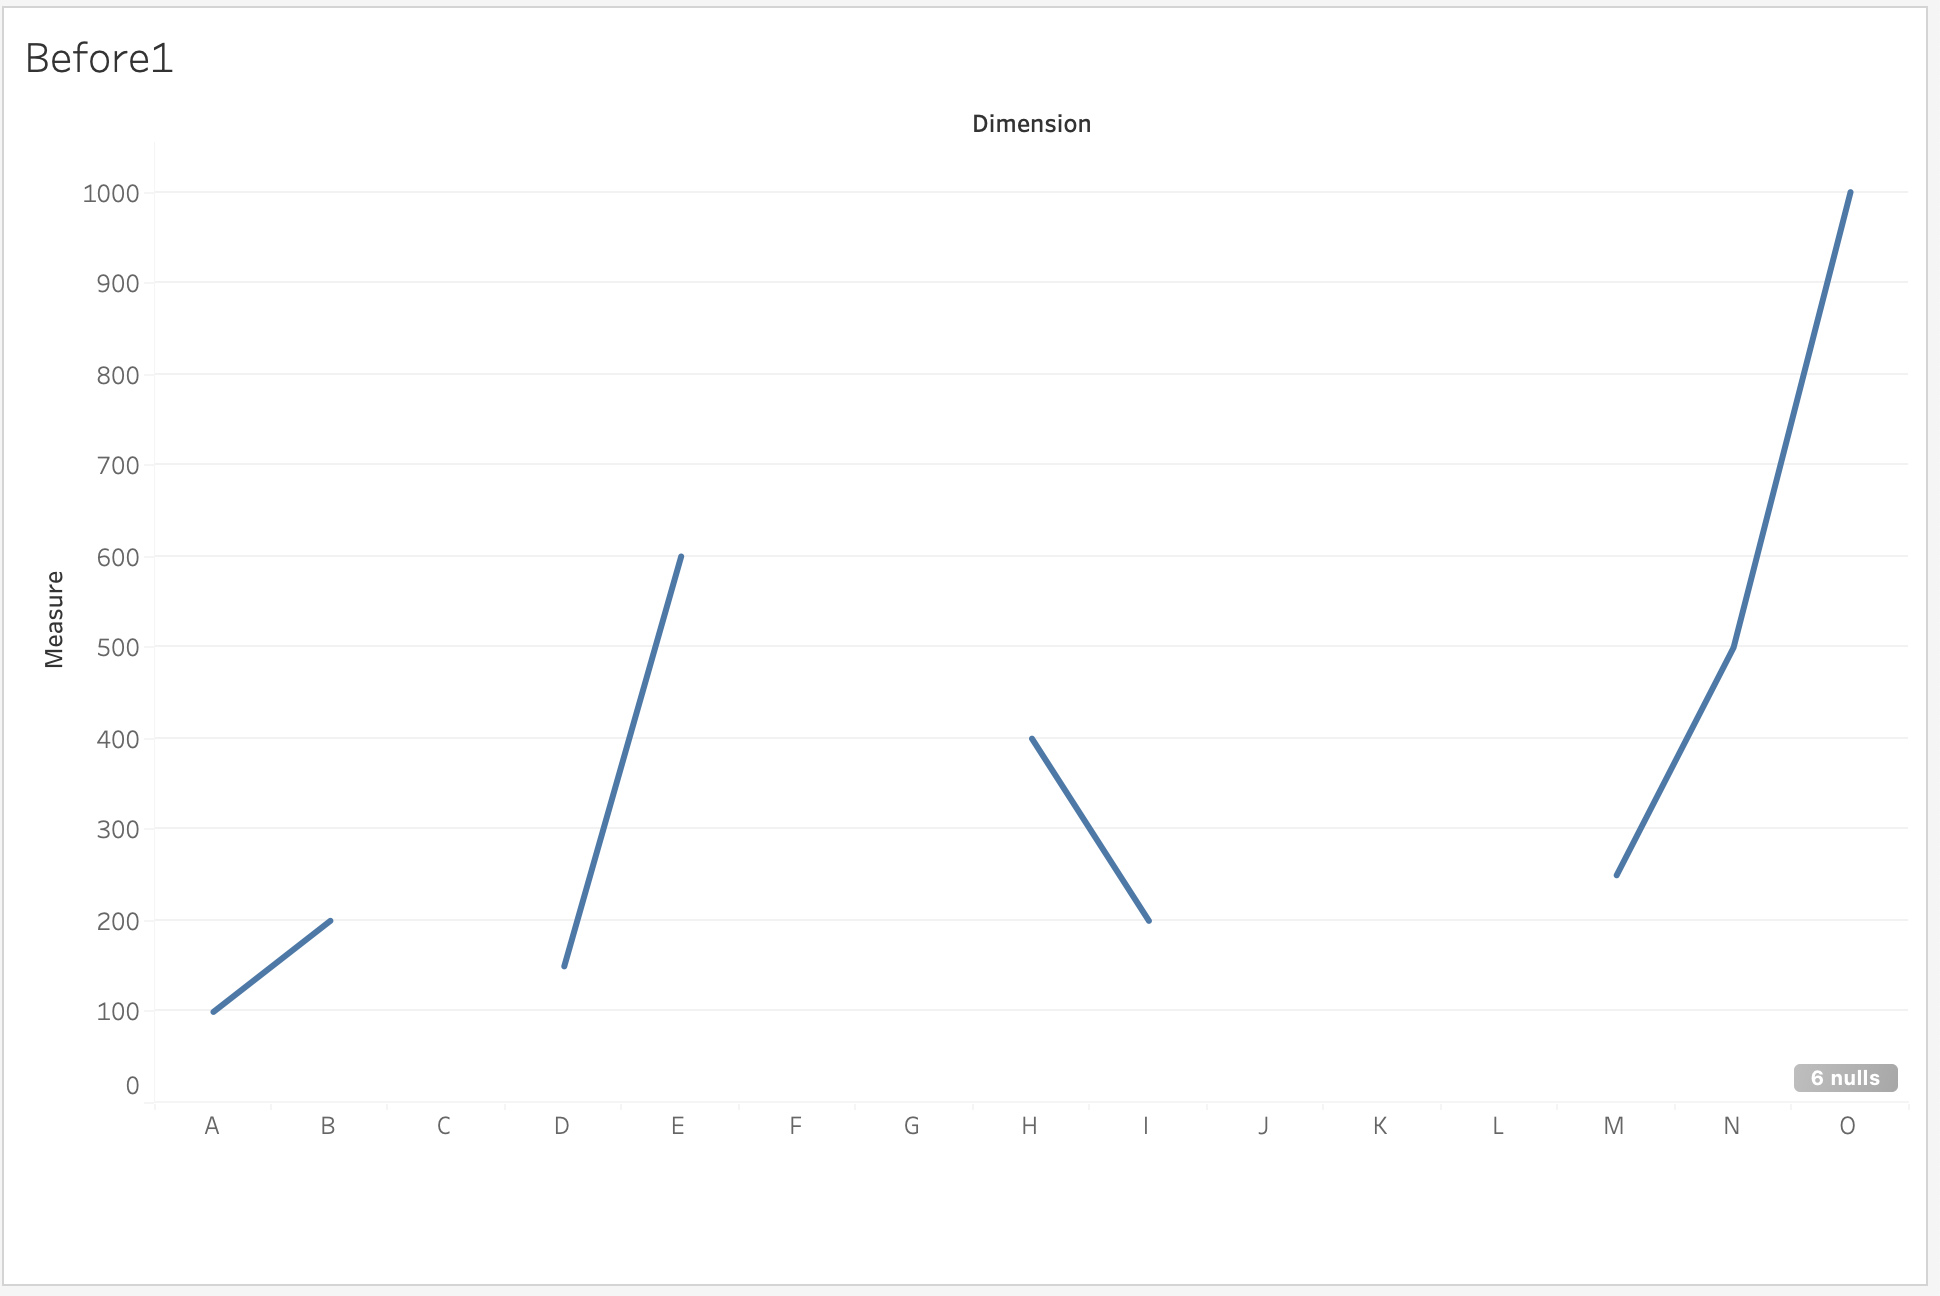
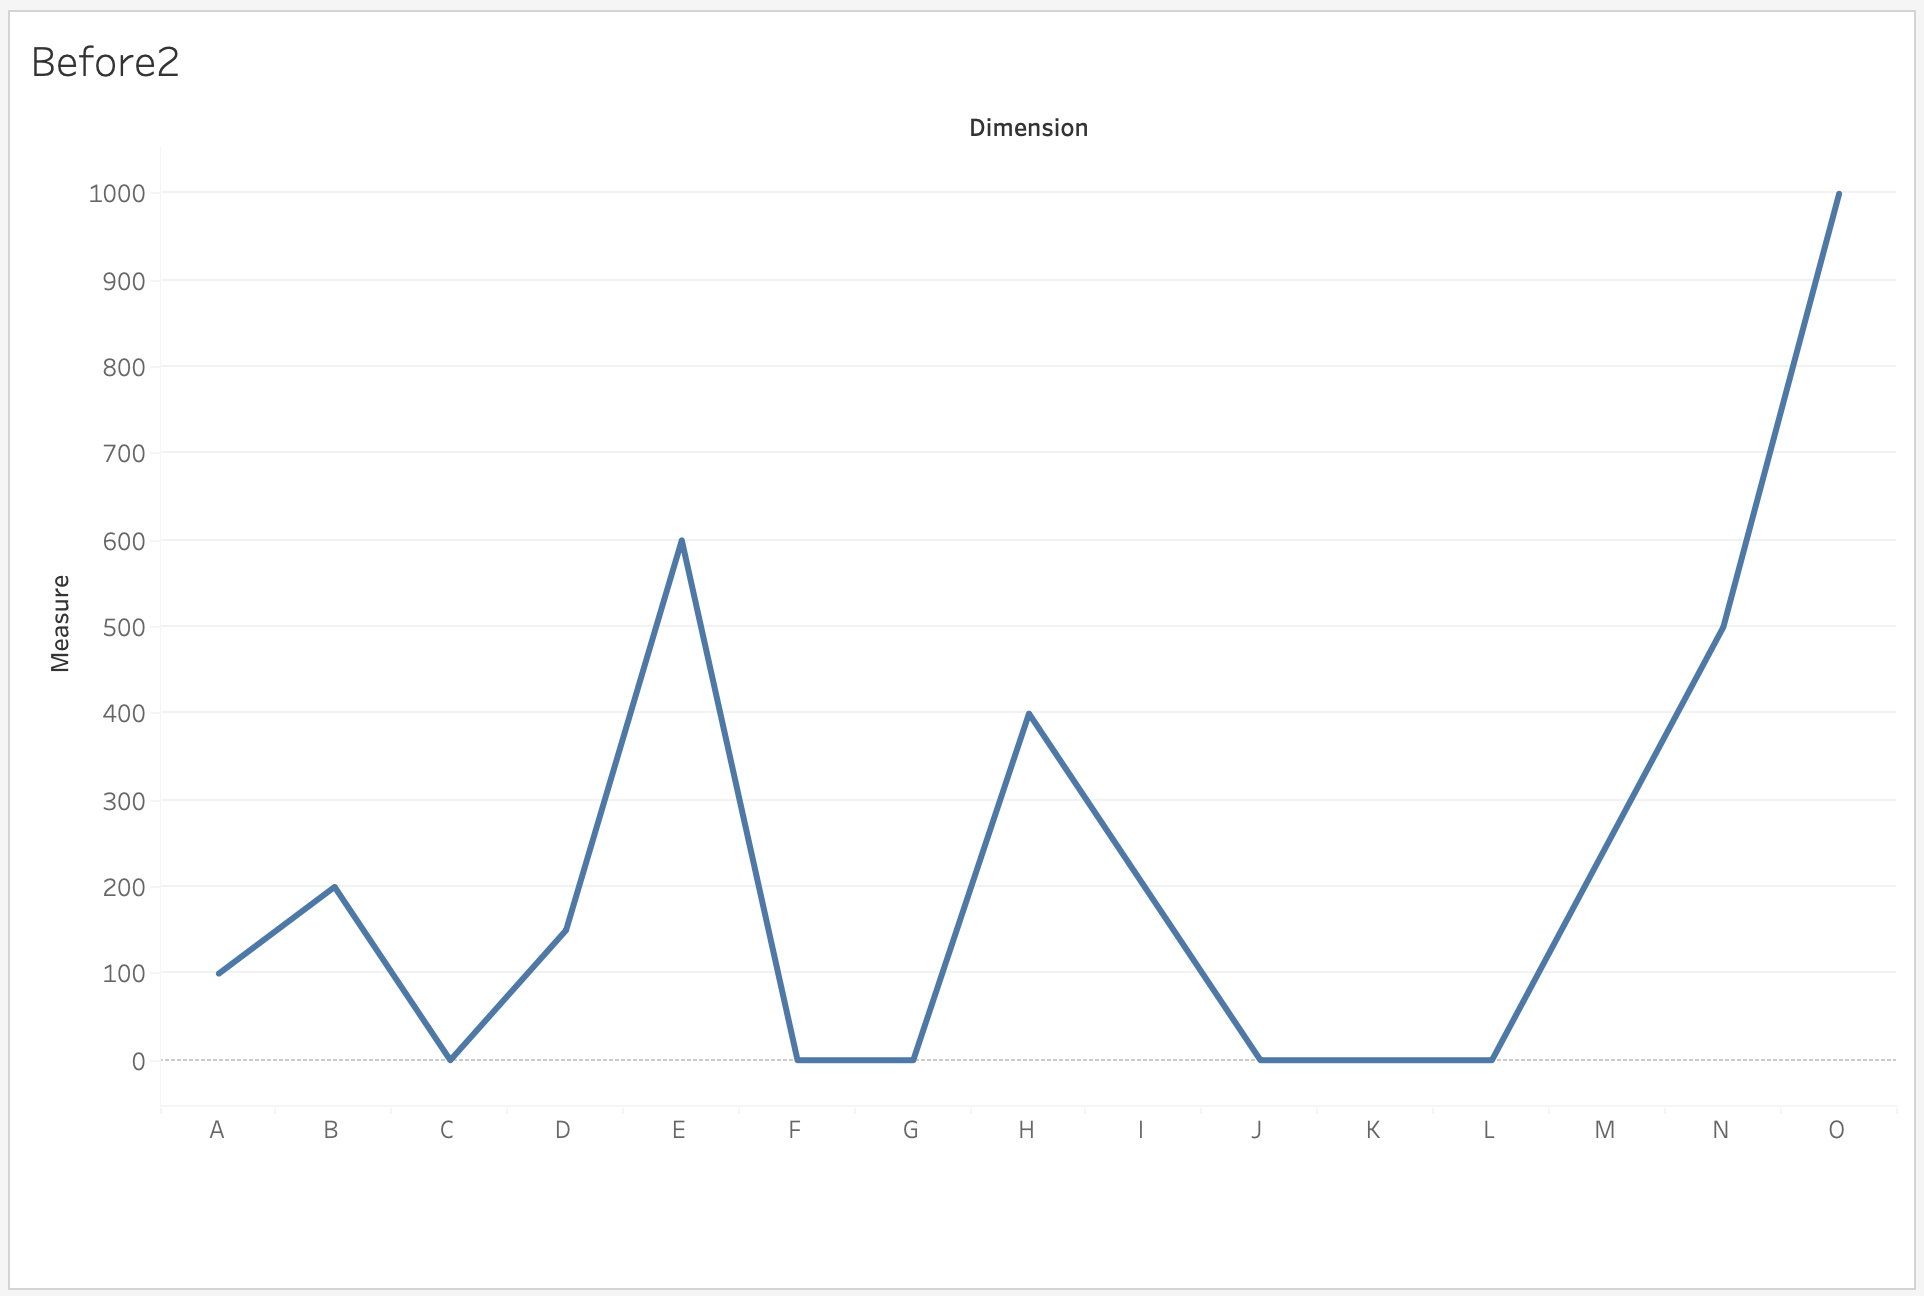
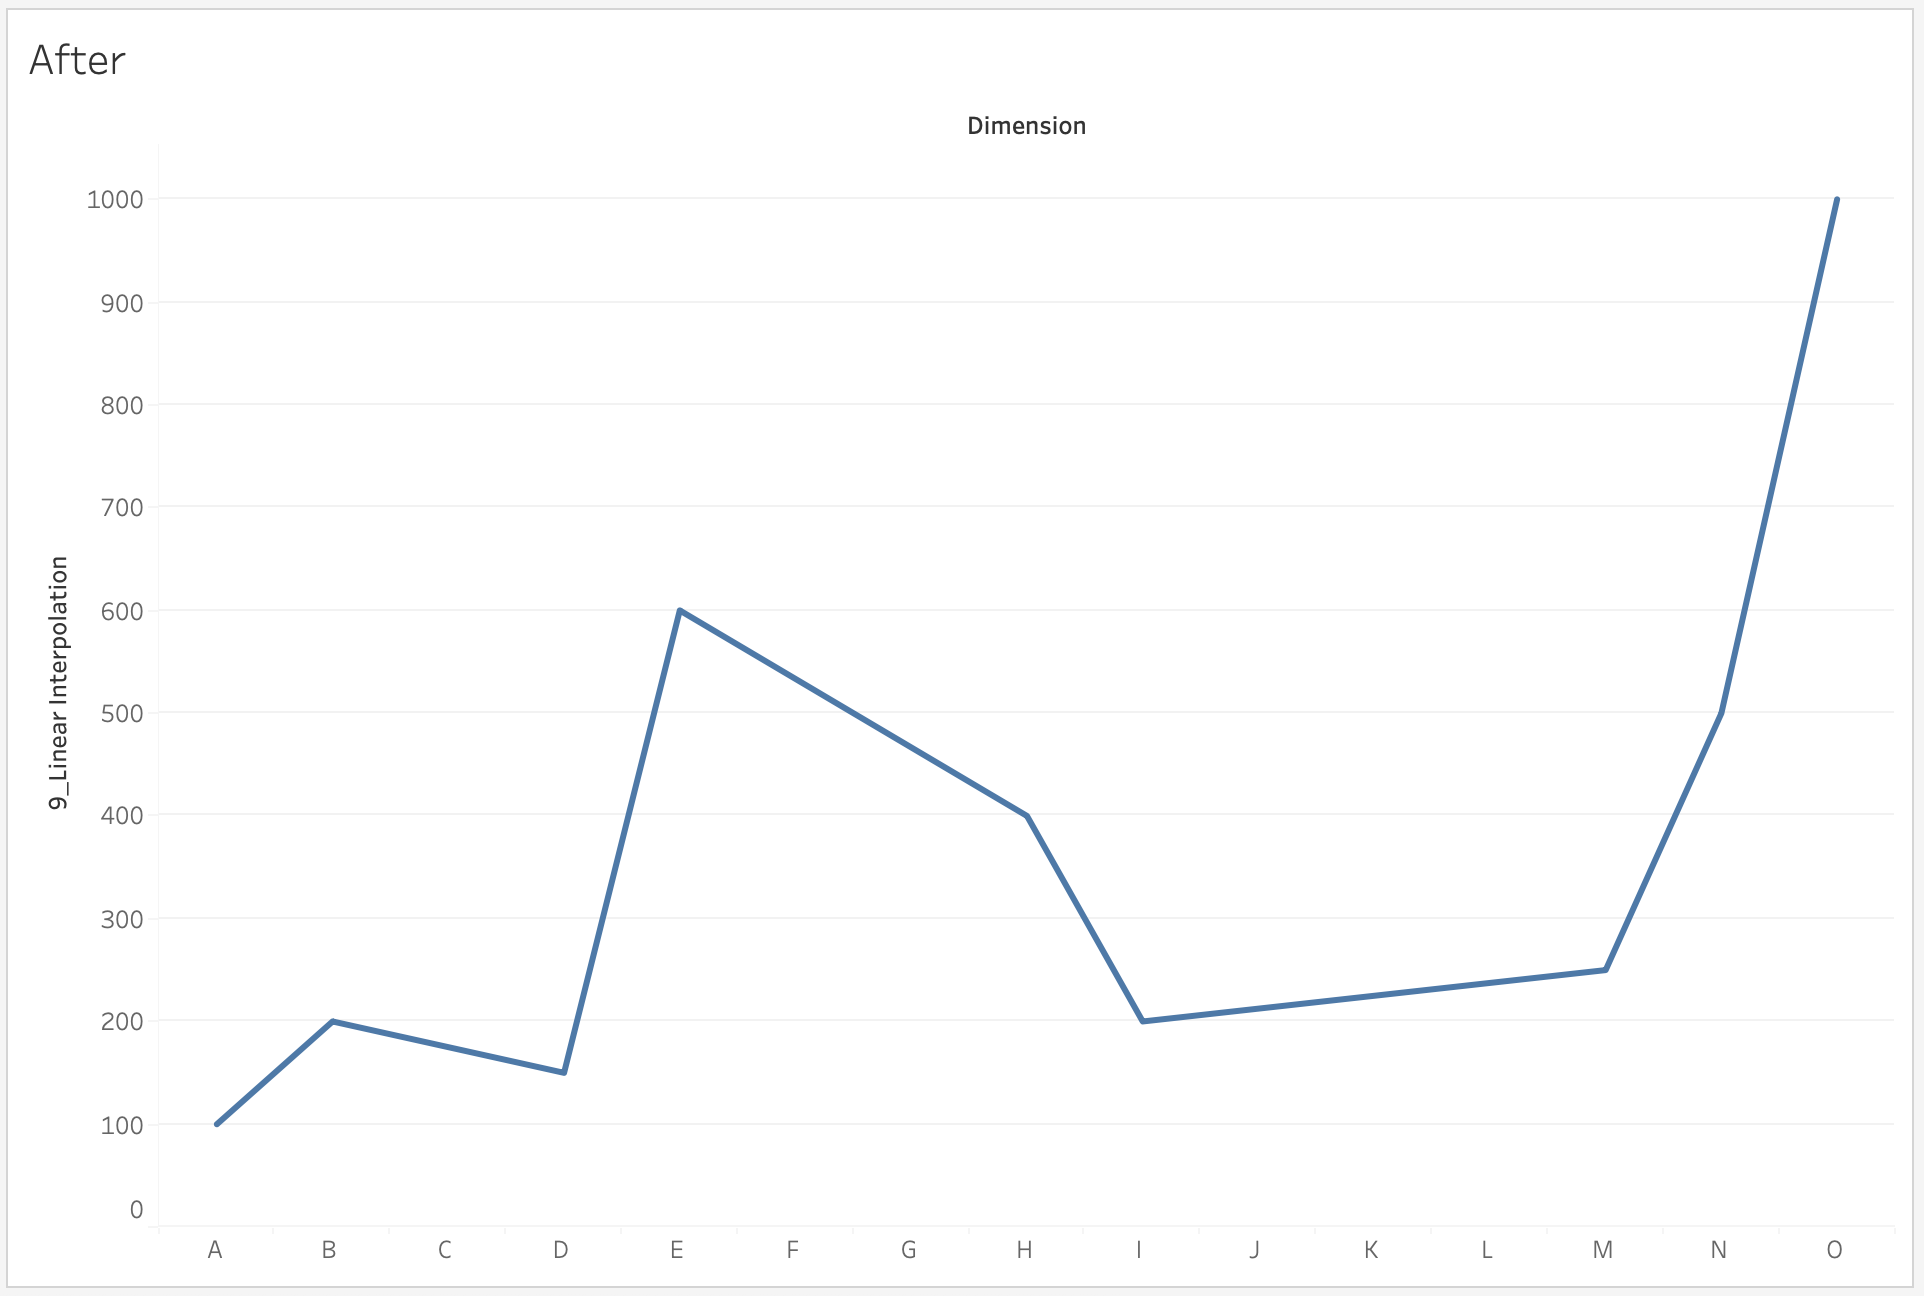
The task is to implement Linear Interpolation to achieve following line chart.
단계
To implement linear interpolation with sparse data, create following calculated fields and edit table calculations.
Create Calculated Fields
Select Analysis > Create Calculated Field... to create the following calculation fields
- 1_existing data INDEX
IF NOT ISNULL(SUM([Measure])) THEN INDEX() END - 2_missing data PREVIOUS INDEX
IFNULL([1_existing data INDEX],PREVIOUS_VALUE(0)) - 3_missing data NEXT INDEX
IFNULL([1_existing data INDEX],PREVIOUS_VALUE(0)) - 4_missing data INDEX difference
[3_missing data NEXT INDEX]-[2_missing data PREVIOUS INDEX] - 5_missing data INDEX difference to current spot
INDEX()-[2_missing data PREVIOUS INDEX] - 6_missing data PREVIOUS Measure
IFNULL(SUM([Measure]),PREVIOUS_VALUE(0)) - 7_missing data NEXT Measure
IFNULL(SUM([Measure]),PREVIOUS_VALUE(0)) - 8_missing data VALUE difference
[7_missing data NEXT Measure]-[6_missing data PREVIOUS Measure] - 9_Linear Interpolation
IFNULL(LOOKUP(SUM([Measure]),0),[8_missing data VALUE difference]/[4_missing data INDEX difference]*[5_missing data INDEX difference to current spot]+[6_missing data PREVIOUS Measure])
Build the view
- Drag Dimension to the Columns shelf
- Drag 9_Linear Interpolation to the Rows shelf
Edit Table Calculations
- Right-click 9_Linear Interpolation on the Rows shelf, and select Edit Table Calculation...
- For Nested Calculations, choose 7_missing data NEXT Measure
- For Compute Using, choose Specific Dimensions, and check Dimension
- For Sort order, choose
Custom
Dimension Minimum
Descending - For Nested Calculations, choose 3_missing data NEXT INDEX
- For Compute Using, choose Specific Dimensions, and check Dimension
- For Sort order, choose
Custom
Dimension Minimum
Descending - Close the Table Calculation dialog box
Knowledge 기사 번호
005389112
이 기사를 통해 문제를 해결했습니까?
개선을 위한 의견을 보내주세요.
