You are here:
Set Up Log Streaming to Third-Party Monitoring Tools
For enterprise-scale monitoring and automation, stream logs to third-party analytics platforms, including Splunk, Datadog, Grafana Loki, New Relic, Dynatrace, SumoLogic, and AWS Elastic Cloud. You can also use a generic HTTP connection to stream logs to other tools.
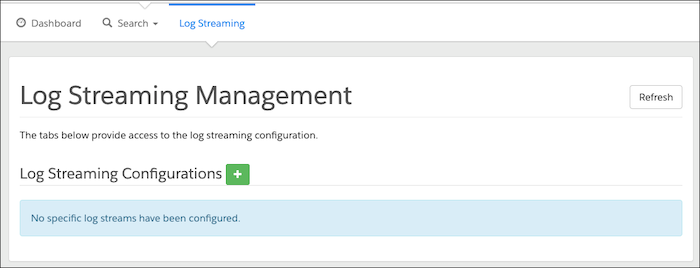
- Log in to Log Center.
-
Select the Log Streaming tab.
-
To create a new log stream configuration, click the Log Streaming
Configurations plus icon.
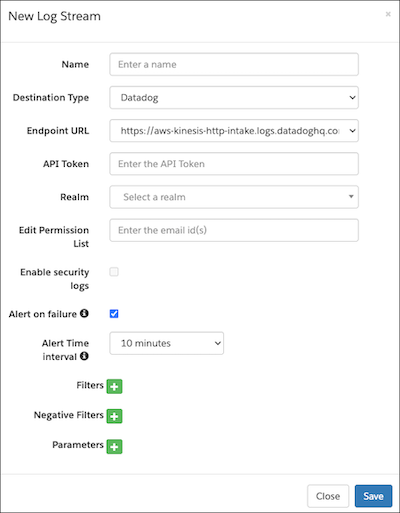
- Enter the log stream name. Use alphanumeric and special characters with spaces. Using the same name for multiple configurations isn’t allowed.
- From the Destination Type dropdown, select the Destination Type. The options include Splunk (Cloud and enterprise are supported), Datadog, New Relic, Grafana Loki, Dynatrace, SumoLogic, AWS Elastic Cloud, and Generic HTTP.
-
Enter the third-party endpoint URL as the destination for the log.
Destination Type ENDPOINT URL Splunk Splunk Cloud: https://http-inputs-firehose-<your_unique_cloud_hostname>.splunkcloud.com
Splunk Enterprise: See Splunk Add-on for Amazon Kinesis Firehose
Datadog US1: https://aws-kinesis-http-intake.logs.datadoghq.com/v1/input
US3: https://aws-kinesis-http-intake.logs.us3.datadoghq.com/api/v2/logs?dd-protocol=aws-kinesis-firehose
US5: https://aws-kinesis-http-intake.logs.us5.datadoghq.com/api/v2/logs?dd-protocol=aws-kinesis-firehose
AP1: https://aws-kinesis-http-intake.logs.ap1.datadoghq.com/api/v2/logs?dd-protocol=aws-kinesis-firehose
EU: https://aws-kinesis-http-intake.logs.datadoghq.eu/v1/input
New Relic Grafana Loki https://aws-logs-prod.grafana.net/aws-logs/api/v1/push Dynatrace https://live.dynatrace.com/api/v2/logs/ingest/aws_firehose SumoLogic AWS Elastic Cloud https://es.aws.elastic-cloud.com Generic HTTP Any HTTPS endpoint that can receive delivery from Firehose, per specification. - Enter a user ID (required for Grafana Loki).
-
Enter the API token for the third-party tool.
Destination Type API Token Documentation Reference Splunk Authentication Token Splunk Add-on for Amazon Kinesis Firehose Datadog Authentication Keys Datadog API and Application Keys New Relic API Keys New Relic API Keys Grafana Loki Token Grafana Labs: Configure Logs with Firehose Dynatrace API Token Stream logs via Amazon Data Firehose SumoLogic Any Sumo Logic: AWS Kinesis Firehose for Logs Source AWS Elastic Cloud API Key Elastic: Monitor Amazon Web Services (AWS) with Amazon Data Firehose Generic HTTP Customized Authentication Not applicable. -
Select the realm from the dropdown menu, and then configure the number of
streams.
For each realm, configure up to 5 streams per destination type.
-
(Optional) For Edit Permission List, enter a comma-separated list of email IDs for
the users who have edit access. Note these guidelines.
- The user who configures the log stream is the primary owner.
- The primary owner can enable, edit, and delete permissions for other users
assigned to the same realm.
- Identify users with a comma-separated list of their email IDs. There's no limit to the number of email IDs.
- Invalid or incorrect email addresses are ignored.
- Users assigned to the same realm can view the realm but don't have edit or delete permissions.
-
(Optional) Set Filters. Click the plus sign.
Enter the filter field values exactly as shown in the table or the parameter are ignored.
- For multiple values of a single filter type, use the OR operator
- For multiple filter types, use the AND operator
- Filters and negative filters can’t be configured for the same type.
- Each row represents one filter type. If you configure multiple rows with the same type, they’re combined
Types Description Example Category Logs category type from search aggregation. Enter a comma-separated list of values. - Category Type
- system
- custom
- customfiles
- Jdbc
- syslog
- api
- job
- staging
- sysevent
- analytics
- quota
- deprecation
- impex
- batch
- migration
Request Logs request type from search aggregation. Enter comma-separated list of values. - Request Type
- JOB
- BUSINESSMGR
- STOREFRONT
- TEMPORARY
- REST
Service Logs service type from search aggregation. Enter comma-separated list of values. - Service Type
- ecom
- JWA
- MRT
Severity Logs severity from search aggregation. Enter a comma-separated list of values. - Severity
- info
- warn
- error
- debug
- fatal
Tenant Name Logs tenant name ID from search aggregation. Enter a comma-separated list of values. - Tenant Name
- production.functional09.qa222 bgzz_prd
- dev02.functional09.qa222 bgzz_s02
- dev04.functional09.qa222 bgzz_s04
Tenant Type Logs tenant type from search aggregation. Enter a comma-separated list of values. - Tenant Type
- sbx
- prd
- stg
- dev
-
(Optional) Set Negative Filters. Click the plus sign.
- For multiple values of a single filter type, use the OR operator
- For multiple filter types, use the OR operator
- Filters and negative filters can’t be configured for the same type
- Each row represents one type of filter. If you configure multiple rows with the same type, they’re combined
-
(Optional) Set Parameters. Click theParameters plus icon.
Parameters allow you to customize any extra HTTP header, which ends up as an X-Amz-Firehose-Common-Attributes header. For more information, see Amazon Data Firehouse request and response specifications..
- Grafana Loki parses HTTP header key with the prefix lbl_ into tags.
- Datadog parses HTTP header keys into tags.
- New Relic parses HTTP header key into attributes.
- Splunk and Dynatrace don't support parameters
- Sumo Logic accepts _sourceCategory and _sourceName attributes for filtering.
- AWS Elastic Cloud accepts the parameters es_datastream_name, include_cw_extracted_fields, and . For more information see Monitor Amazon Web Services (AWS) with Amazon Data Firehose .
- Duplicate parameters aren’t combined.
- Save your configuration changes.
- Click Close.
- After you configure log your streaming, click Refresh, and check for any error messages.