You are here:
Communications Sales Insights Opportunities Dashboard
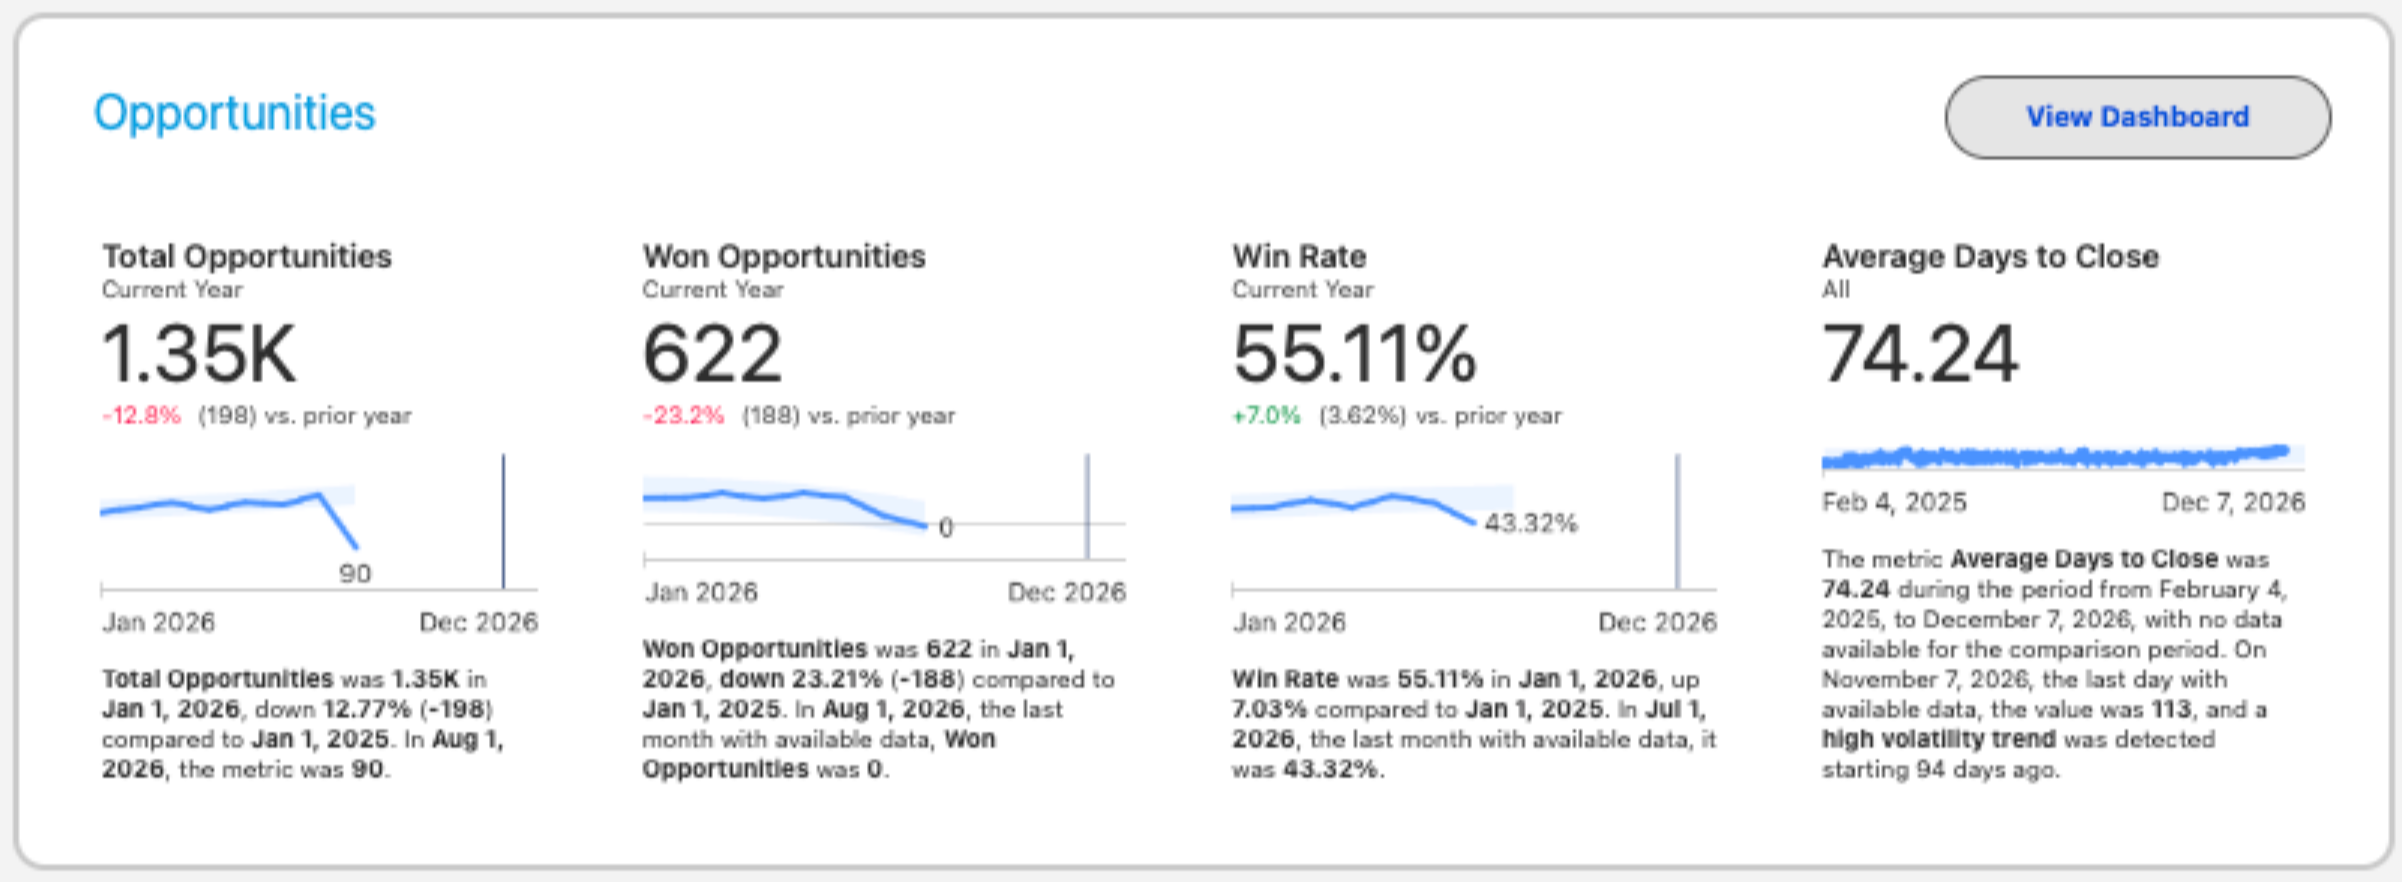
The Opportunities Dashboard gives you a comprehensive view of your sales pipeline and opportunity performance, including win rates, open deal size, and stalled opportunities.
Opportunities Dashboard KPIs
The table shows each KPI on the Opportunities Dashboard and how Communications Sales Insights calculates it.
| KPI | Calculation |
|---|---|
| Total Opportunities | Total number of opportunities that match the selected filters. |
| Won Opportunities | The total amount of all Closed Won opportunities. |
| Win Rate | Won opportunities divided by total opportunities. |
| Average Days to Close | The sum of CloseDate minus CreatedDate for all Closed Won opportunities divided by the total number of Closed Won opportunities. |
| Total Open Opportunities | Number of open opportunities. |
| Average Open Deal Size | The average total amount of all open opportunities where Is Closed is false. |
| Average Days Open | The sum of today's date minus CreatedDate for all open opportunities divided by the total number of open opportunities. |
| Top Open Opportunities by Stage | Shows your current opportunities stacked by dollar amount. This metric surfaces the opportunities that can help you meet your quota. |
| Top Open Opportunities by Accounts | Shows the accounts with the most opportunities stacked by dollar amount. This metric can help you determine which accounts to focus on. |
| Top Open Opportunities by Products | Shows the products you selected when creating the opportunity, sorted by dollar amount. This metric can help you understand which products to focus on. |
| Stalled Opportunities (opportunities not touched in 60+ days) | Top open opportunities by amount that haven't been touched in 60 days that are set to close in the selected period. |
Did this article solve your issue?
Let us know so we can improve!