You are here:
Use the Data Mapping Visualizer
Use the Data Mapping Visualizer tool to view an animated display of mapped data in your Marketing Cloud Intelligence workspace.
Required Editions
| User Permissions Needed | |
|---|---|
| To use the data mapping visualizer: | Admin |
-
From the Connect & Mix tab, select Data Streams, and then Data Mapping Visualizer.
-
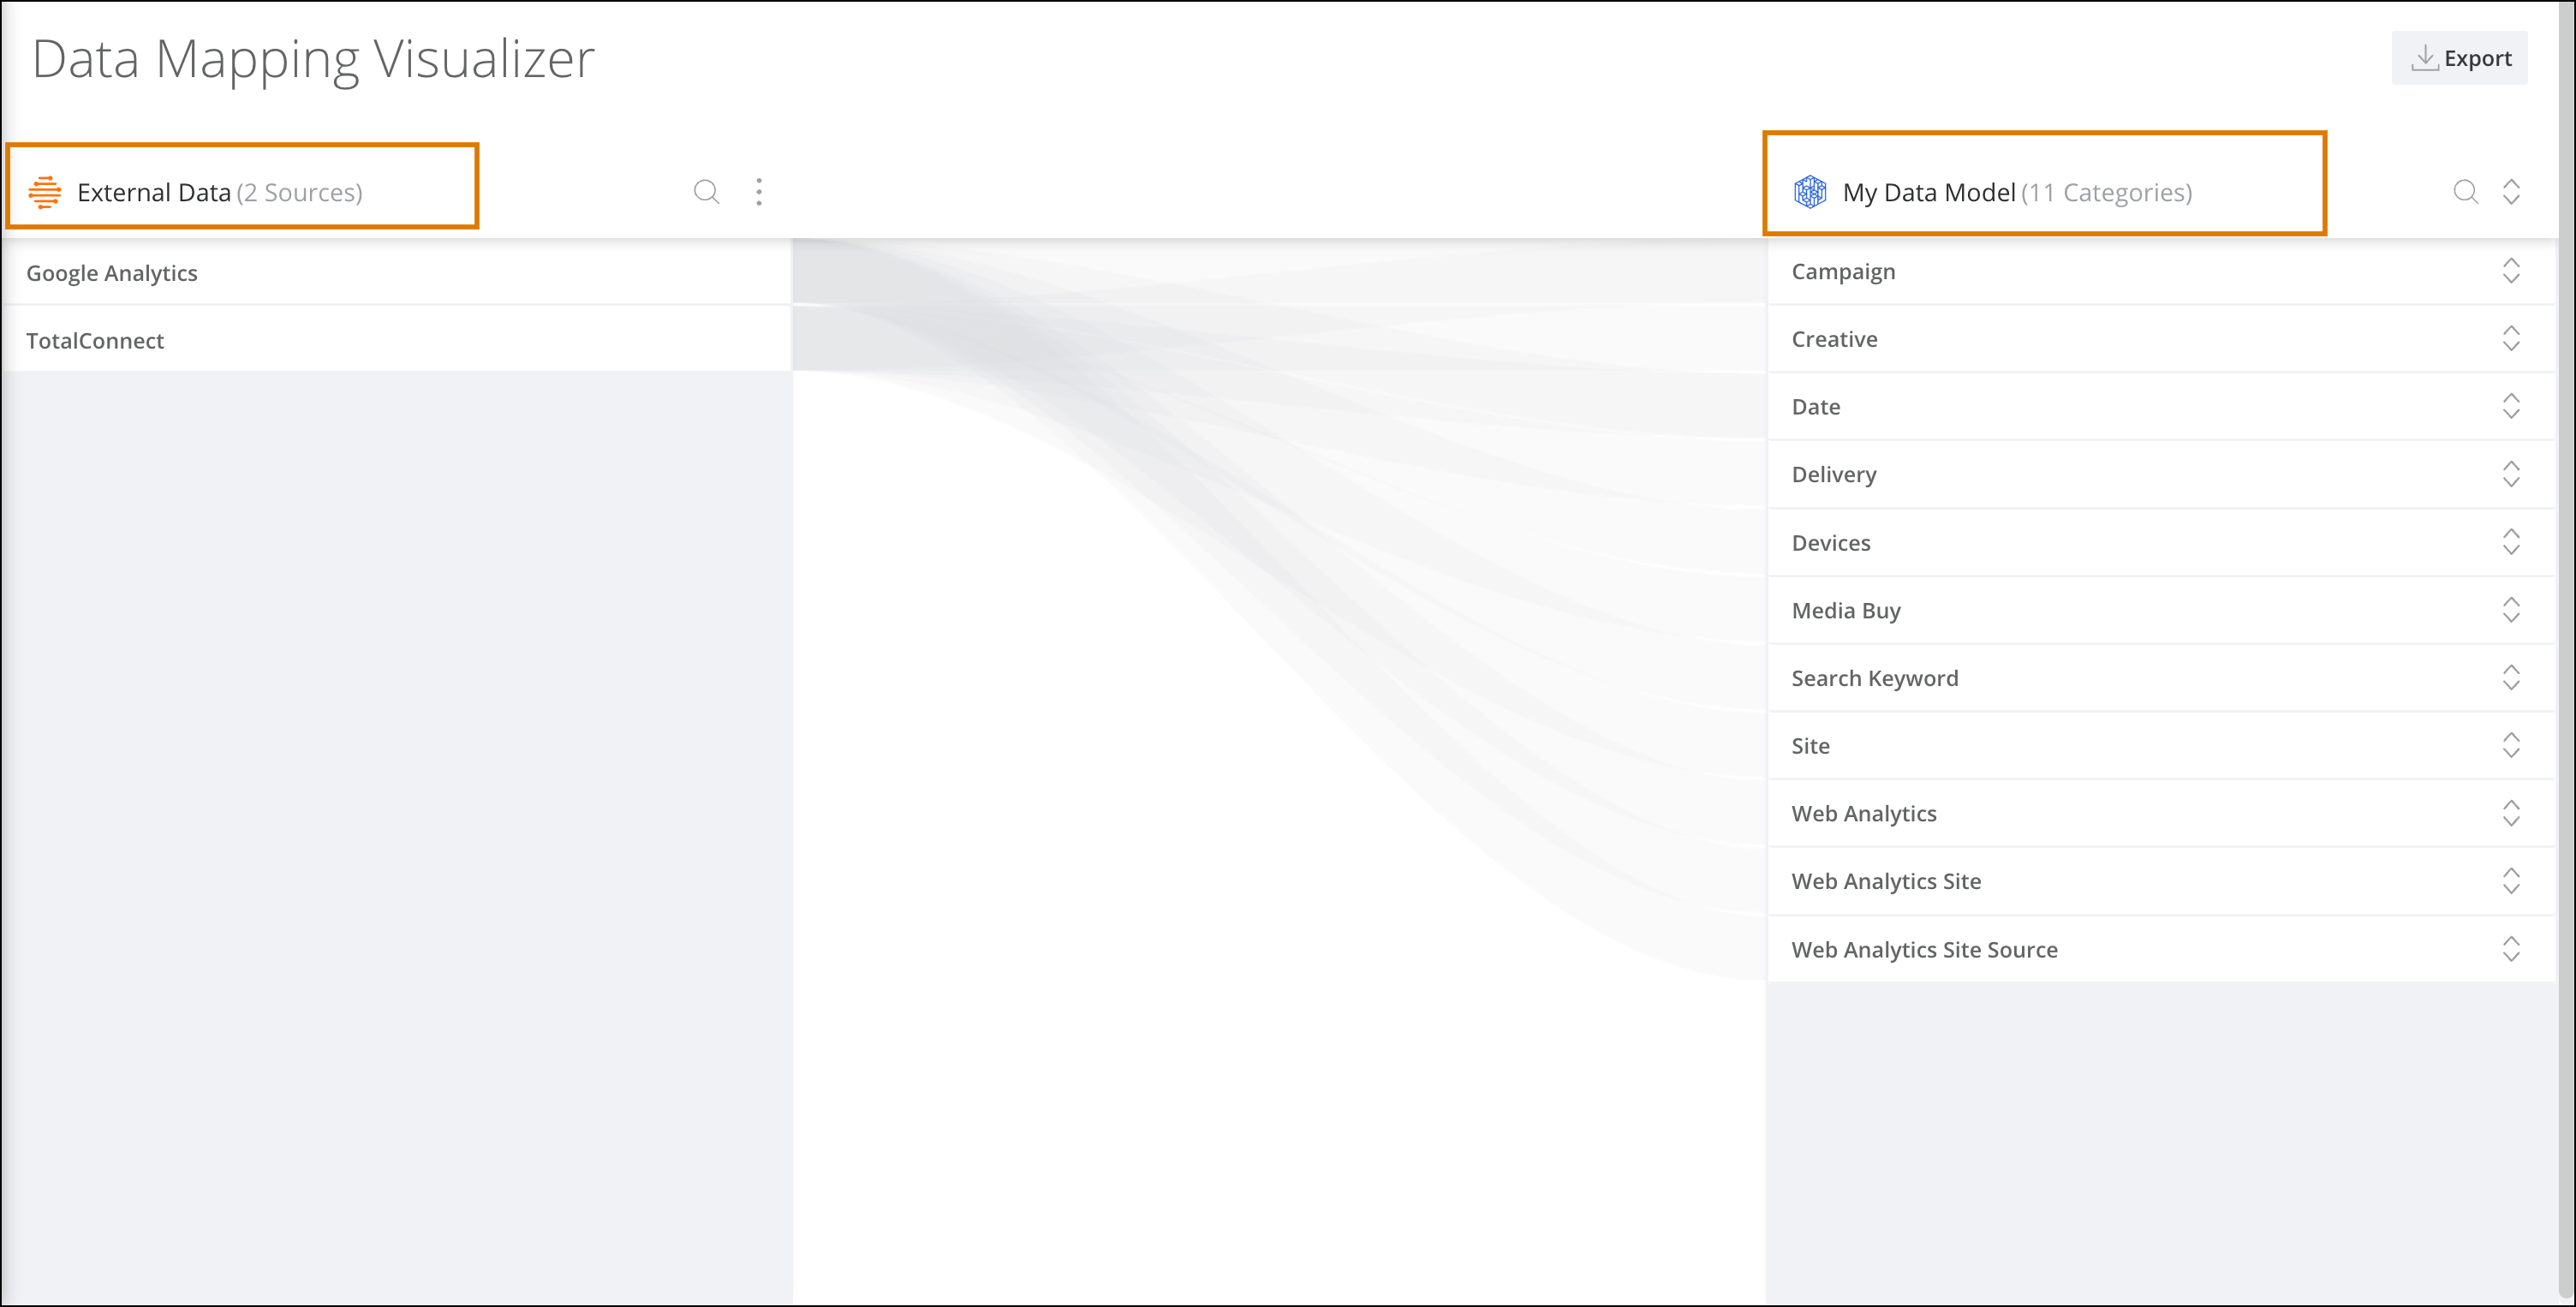
The Data Mapping Visualizer has two columns
External Data where the Source data is grouped. My Data Model where the Marketing Cloud Intelligence entities are grouped. -
Hover over the entity to see a visual display of how the entities are connected in the
other column based on the mapping configurations. For example, hover over an External Data
entity to see the connected fields highlighted in the My Data model column.
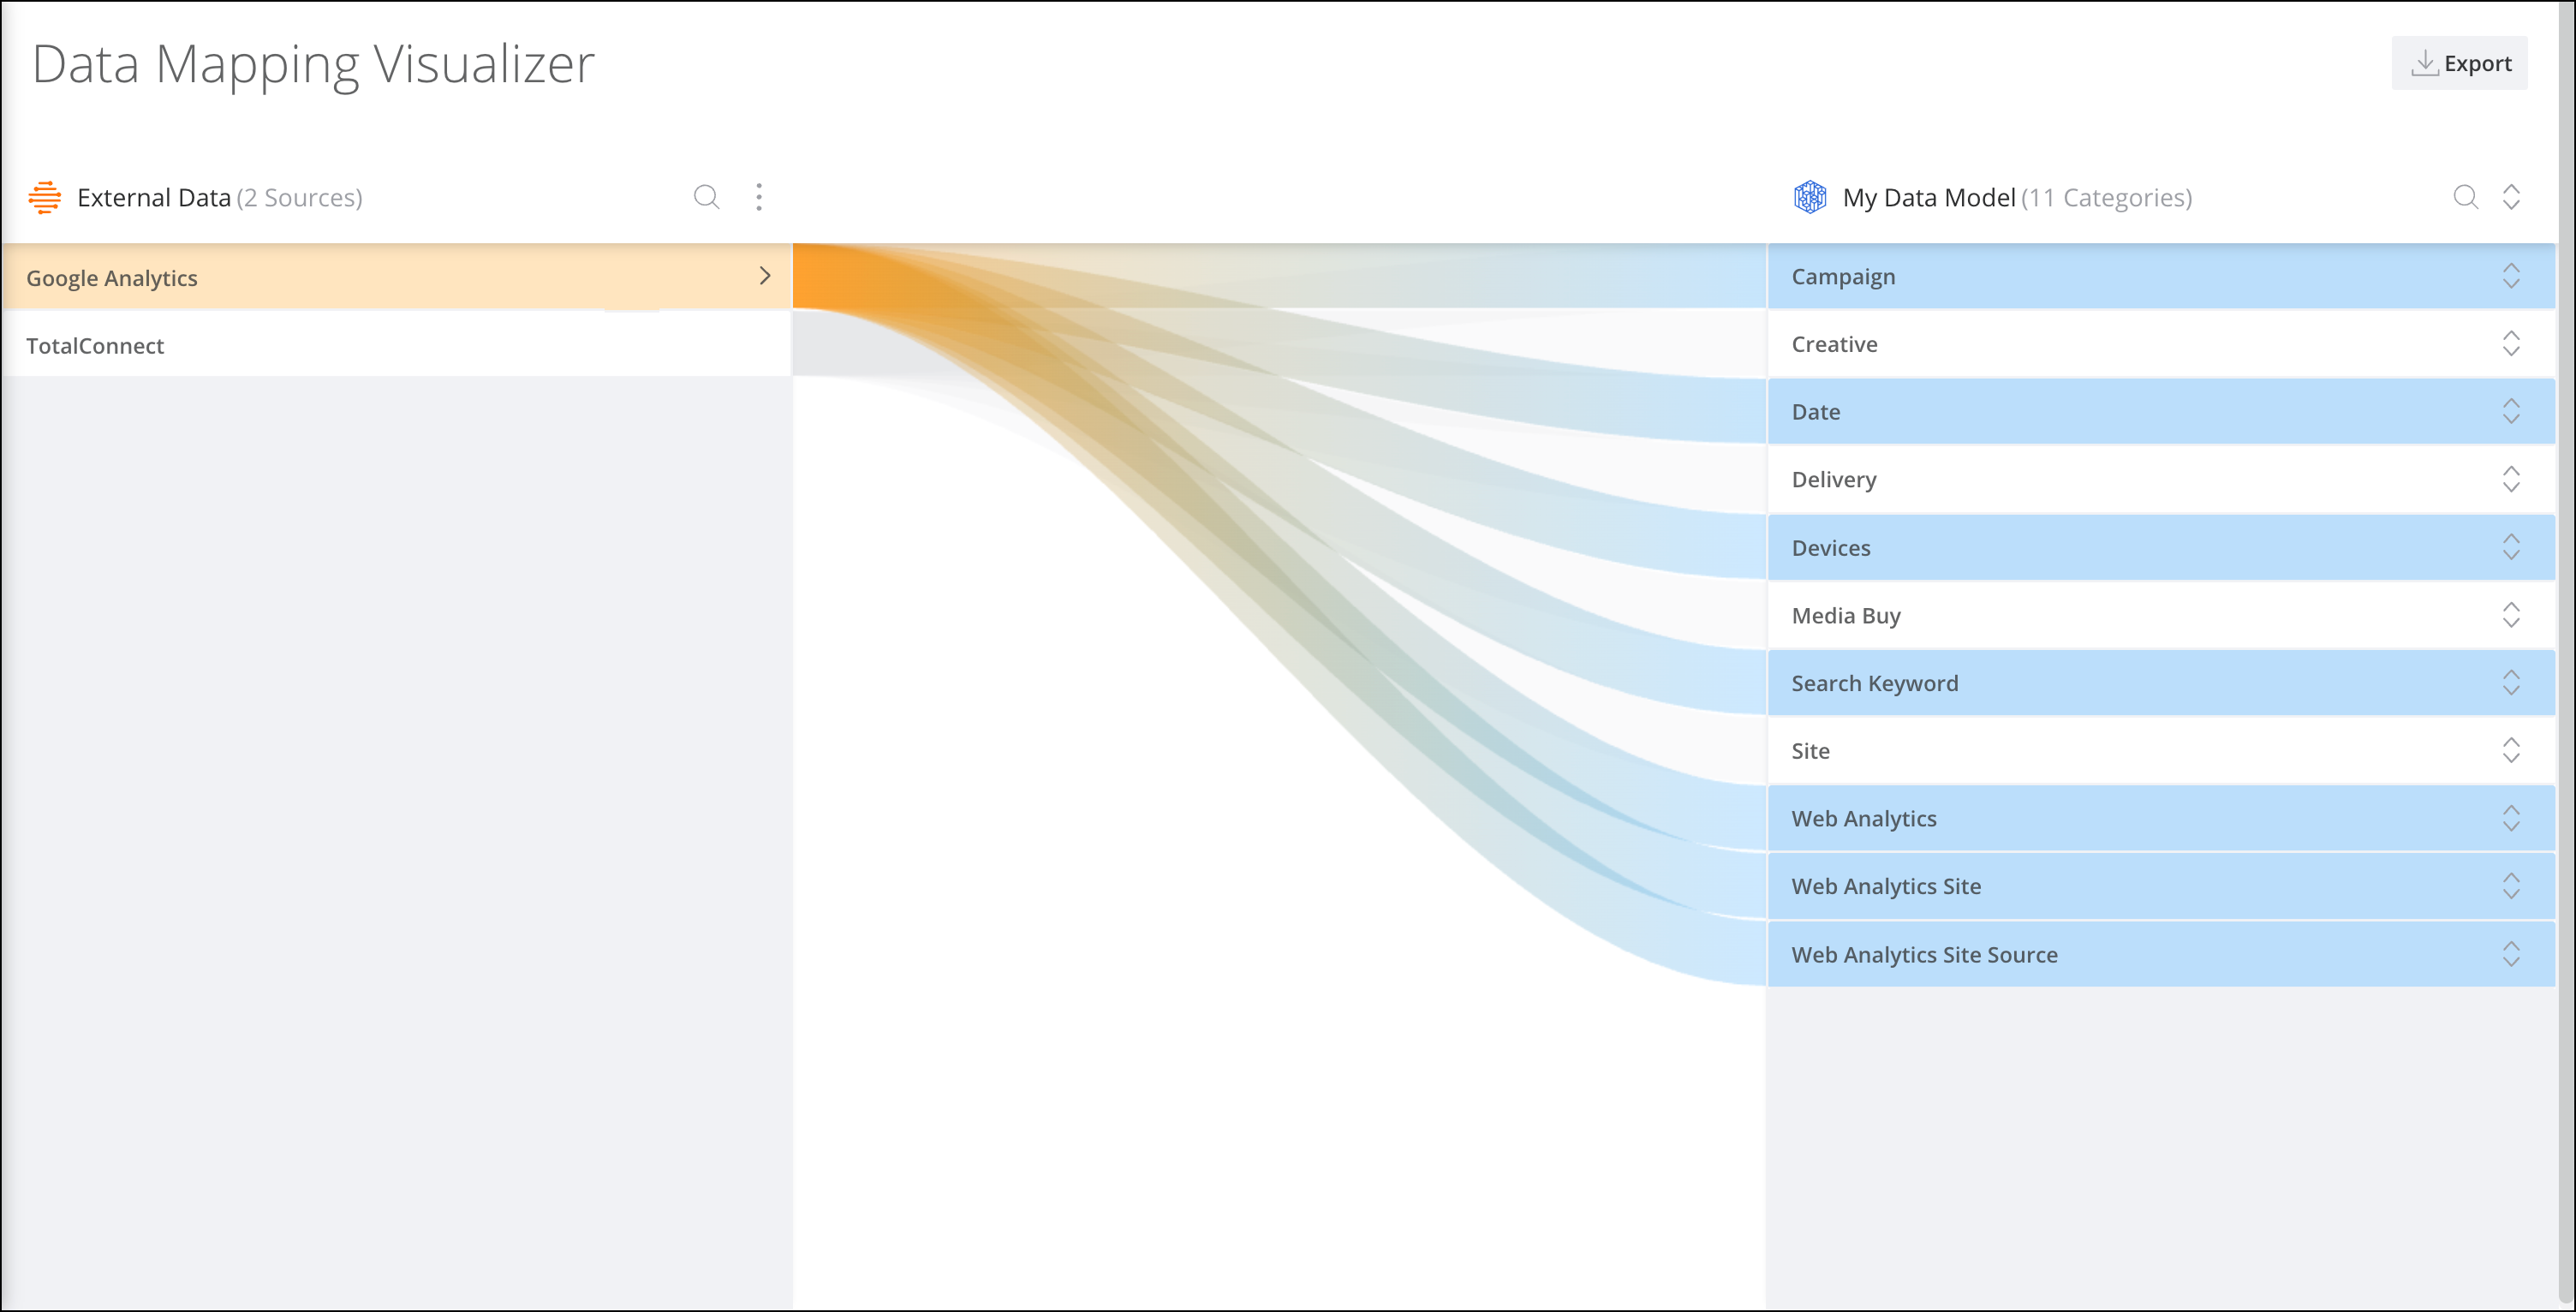
- To keep a connection with a specific entity, click the selected entity. The selected entity stays highlighted when you continue scrolling. For example, when you’re scrolling through a long list on the Data Model column or if you want to compare your mapped data to another file.
-
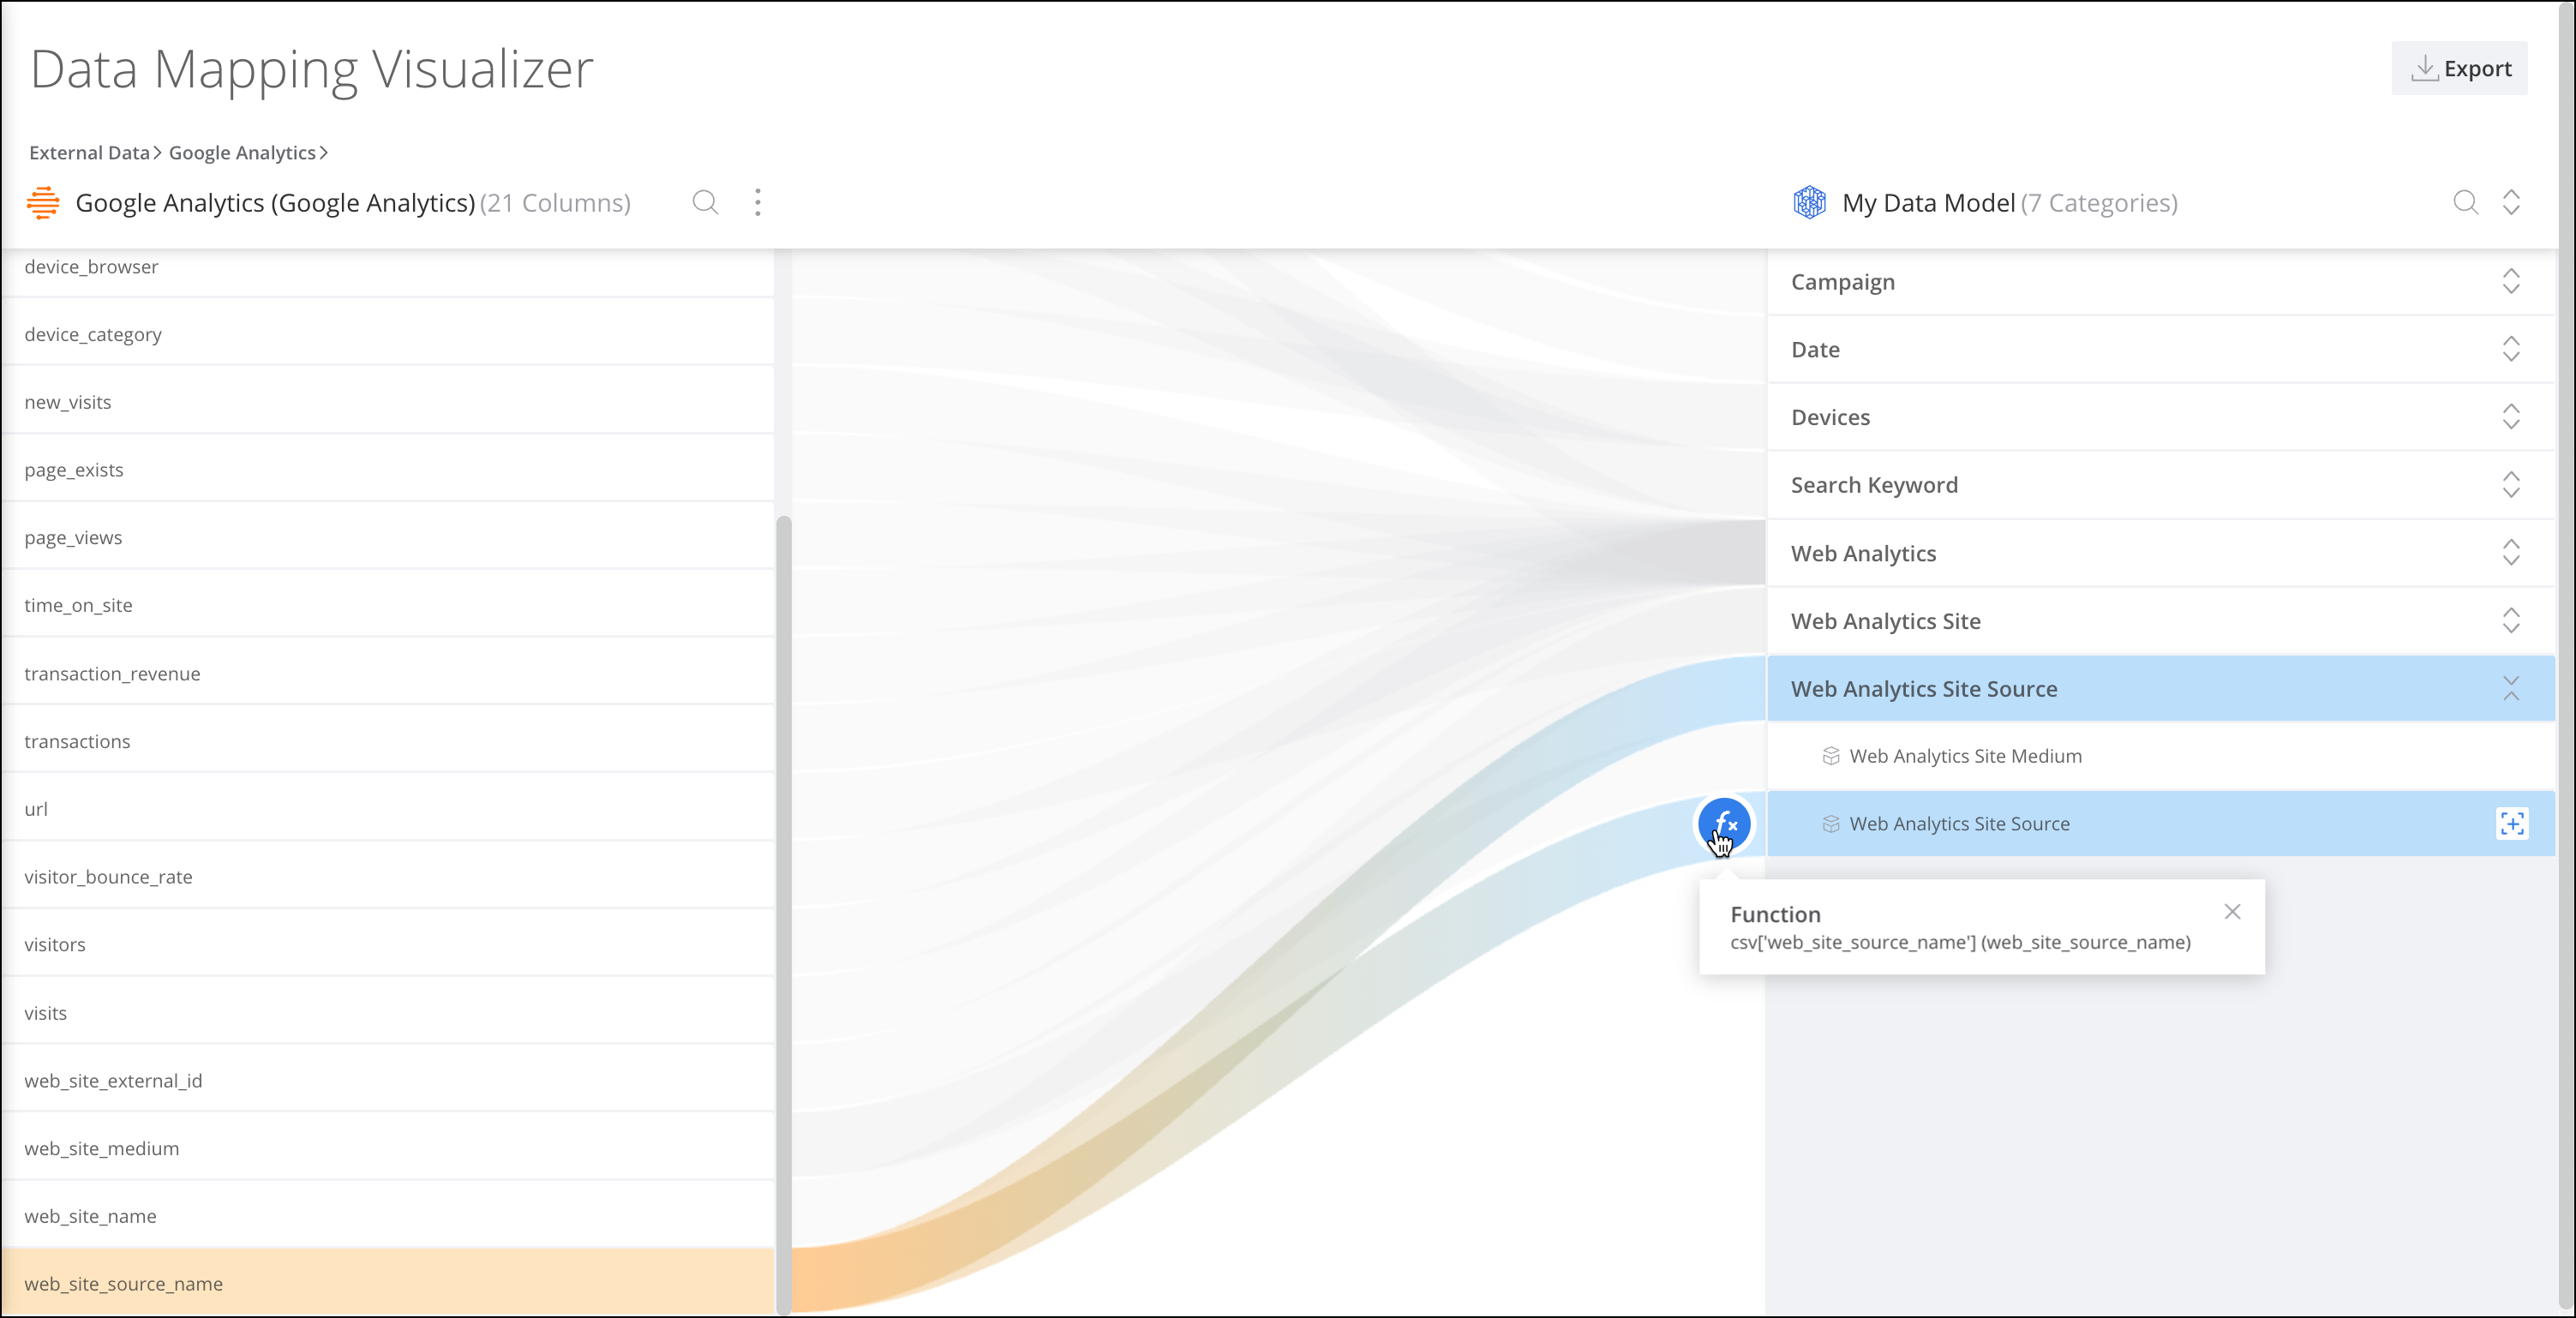
When an entity is selected you can view the contents of a mapping formula at the lowest
level of the drill-down on both columns. For example, if you drill down to the source field
level on the External Data column and the Data
Model column you can see the mapping formulas. A formula icon appears when a
source field is mapped using a mapping formula. To view the mapping formula contents, click the
icon.
此文章是否解決您的問題?
請讓我們知道,以便我們改進!