
You are here:
Adobe Analytics Custom API Connector
The Adobe Analytics Custom API Connector allows you to retrieve a custom set of Measurements and Dimensions from the Adobe Analytics API into Marketing Cloud Intelligence Data Pipelines.
The standard Adobe Analytics API connector is preset to be accurately mapped to the Data Model, while the Custom connectors require manual setup. Use the Adobe Analytics Custom Connectors to retrieve unique measurements, data from the Data Warehouse reports, or if you want to retrieve calculated metrics and segments from the Analytics reports.
- Channel: Web Analytics
- Data Stream Type:
- Ads Conversion Tag
- Generic
- Web Analytics
- Web Analytics Events
- Web Analytics Tags
- Web Analytics Pages
- Data Lag: 1 Day
Prerequisites
To connect to Adobe Analytics, you need a valid username and Secret Key.
- To retrieve your User Name value, combine your User Name and Company Name values in the following format: Username:Company.
- The Secret Key is different from a password and is found within the Adobe Analytics platform, under My Account > Edit Profile > Web Service. Copy the string in the Shared Secret field.
- If you’re unable to see your Shared Key, contact your Adobe Analytics Administrator.
General Setup
Enter your credentials and select the Profile you want to pull data for.
- Account – Select the Adobe Analytics account you want to retrieve data for. This correlates to the Report Suite in Adobe Analytics.
- Segments – Select the Segment you want to retrieve data for. This section is optional and you can only select one segment per Data Stream; however, you can add multiple Segment values within the Extended Properties (see below).
- Fields – Select the fields you require. You can select up to 3 Dimensions per Data Stream and up to 30 Measurements. Dimension fields are identified with the prefix (ELEMENT) and Measurements are prefixed with (METRIC).
Extended Properties
- Override Segments – Insert the Segment IDs of the segments you want
to pull. This is only relevant if you want to query more than one segment per Data Stream.
Separate each segment ID with a comma.
 Note The values inserted here override the segment selected in the General Setup section (see above).
 - Date Granularity – Select the date granularity you want to retrieve
your data for:
- Daily
- AggregatedNote If Aggregated is set, the data is retrieved without a Day Dimension, so you’ll need to apply a Date in the Mapping Screen.
- Data Stream Type – Select one of the available Data Stream Types you
want to map your data to. You can only select one type of Data Stream Type in any given Adobe
Analytics Custom API Data Stream. You can map into the following Data Stream Types:
- Ads
- Conversion Tag
- Generic
- Web Analytics
- Web Analytics Events
- Web Analytics Tags
- Web Analytics Pages
QA Your Data
- Create the desired report in the Adobe Analytics platform for the required date range. Next, process the relevant Data Stream in Marketing Cloud Intelligence Data Pipelines for the same date range.
- Create a Report/Pivot Table within Marketing Cloud Intelligence Data Pipelines containing the exact same Dimensions and Measurements for the same report and date range.
- Compare the Measurement Totals and make sure they’re aligned.
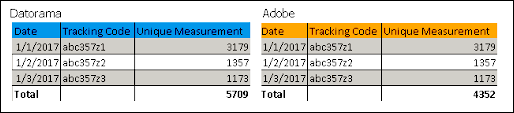
QA Unique Measurements
When Day is selected as the Date Granularity in the Extended Properties, Instead of comparing the Measurement Totals, compare each line measurement.
Using the example below, you can see that each line matches even though the Total does not:
When Aggregated is selected as the Date Granularity in the Extended Properties, look in the Data Stream log within Marketing Cloud Intelligence Data Pipelines to identify the processing batches’ date ranges.
- After it is identified, create the desired report in the Adobe Analytics platform, with the same Dimensions and date ranges like one of the batches that were found.
- Create a Report/Pivot Table within Marketing Cloud Intelligence Data Pipelines containing the same Dimensions and Measurements for the same report and date range.
- Instead of comparing the Measurement Totals, compare each line measurement.