
You are here:
Mass Market Insights Dashboard in Nonprofit
Use the Mass Market Insights dashboard on the Donor Engagement app home page to analyze campaign performance over a specific time period by using key fundraising metrics.
| REQUIRED EDITIONS |
|---|
| Available in: Lightning Experience |
| Available with: Nonprofit Cloud or Nonprofit Cloud for Grantmaking in Enterprise and Unlimited Editions |
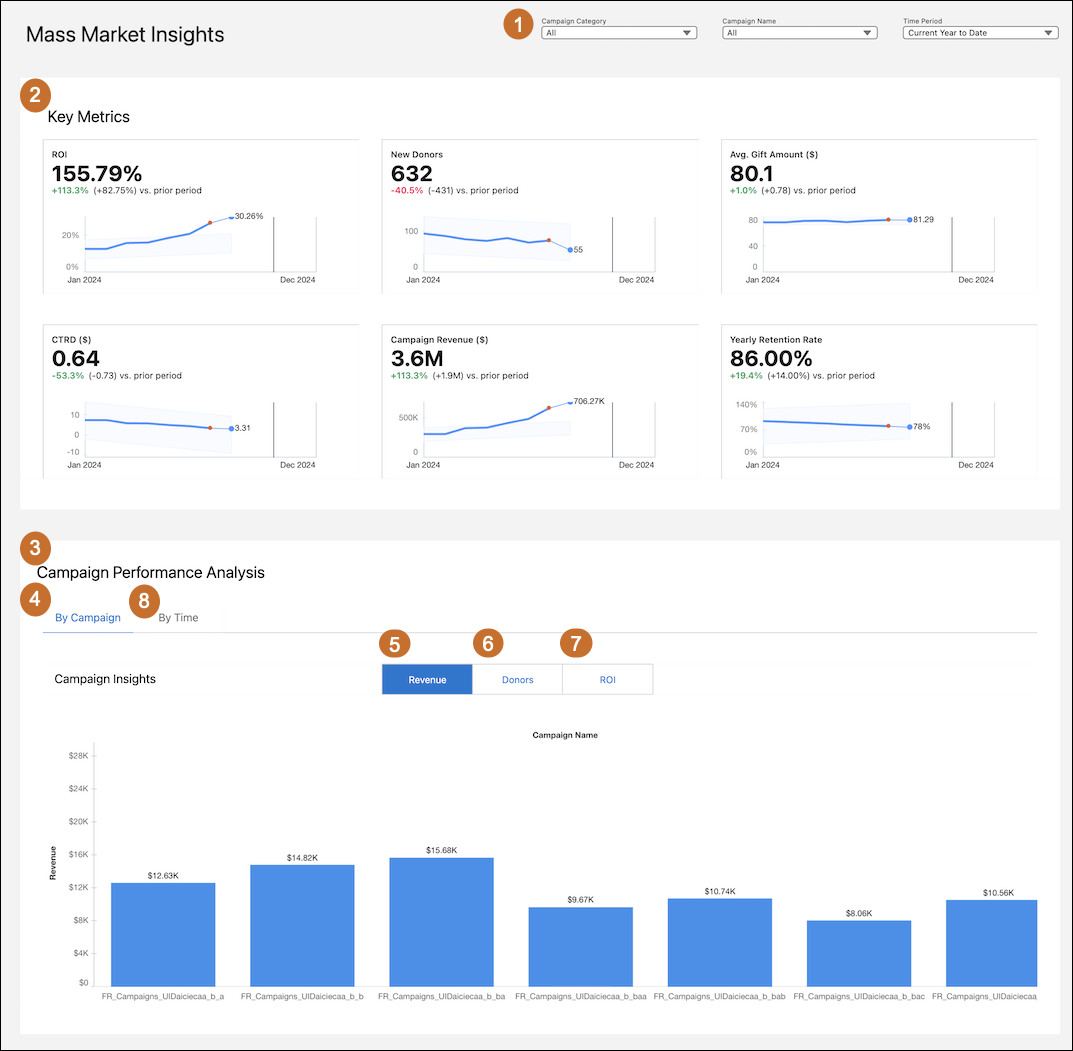
- Use filters (1) to customize the Mass Market Insights dashboard based on specific campaign categories, campaign names, and time period.
- Review the performance of the key metrics (2) for the selected time period.
- Use the Campaign Performance Analysis (3) to get insights into the performance of each fundraising campaign.
- In the By Campaign tab (4), view campaign insights by revenue (5) to see the revenue generated by each campaign; by donors (6) to see the number of donors contributing to each campaign; and by ROI (7) to see the returns generated by each campaign.
- In the By Time tab (8), analyze campaign performance over time by revenue to see changes in revenue over the selected period; and by donors, to see the changes in the number of donors to understand engagement patterns and seasonality.
Example Use Case: A marketing manager can use this dashboard to evaluate the effectiveness of recent fundraising campaigns. By applying filters to compare key metrics such as Return on Investment (ROI), new donors, and average gift amounts across different campaigns, they can identify the best-performing initiatives. The manager can use the metrics to refine strategies for future campaigns, focus on the most effective channels and approaches to maximize donor engagement, and boost overall revenue.
Key Performance Indicators in Mass Market Insights Dashboard
Learn the definitions and calculations of key metrics in the Mass Market Insights dashboard.
| Metric | Description | Calculation | Transaction Category |
|---|---|---|---|
| ROI | The return on investment for a campaign, showing how much is earned compared to what’s spent. | (SUM GiftTransaction.CurrentAmount WHERE GiftTransaction.Campaign = Campaign) / Campaign.ActualCostAmount | Mass Market or Major Donor and Mass Market |
| New Donors | The number of donors who made a donation to the organization for the first time in the selected period. | min((GiftTransaction.TransactionDate) where GiftTransaction.IsPaid = true) = selected time period | Mass Market or Major Donor and Mass Market |
| Avg. Gift Amount($) | The average gift amount across the selected campaigns. | Sum(GiftTransaction.CurrentAmount) / count(GiftTransaction) | Mass Market or Major Donor and Mass Market |
| CTRD($) | The cost-to-revenue ratio for each campaign. | Campaign.ActualCostAmount / (SUM GiftTransaction.CurrentAmount WHERE GiftTransaction.Campaign = Campaign) | Mass Market or Major Donor and Mass Market |
| Campaign Revenue ($) | The total revenue from gift transactions or formal commitments. | Sum(GiftTransaction.CurrentAmount) | Mass Market or Major Donor and Mass Market |
| Yearly Retention Rate | The percentage of donors who donated in the current period as well as in the previous year, compared to the total number of donors who donated in the current period. | Query 1: Total number of donors who donated last year. Query 2: Total number of donors who donated during the selected period. Yearly Retention Rate: (Query 1 / Query 2) *100 |
Mass Market or Major Donor and Mass Market |
| Revenue by Campaign | The chart shows the total revenue generated from each campaign. | Sum (Campaign Revenue) group by Campaign Name | Mass Market or Major Donor and Mass Market |
| Donors by Campaign | The chart shows the number of unique donors contributing to each campaign. | Unique (Donor ID) group by Campaign Name | Mass Market or Major Donor and Mass Market |
| ROI by Campaign | The chart shows the average return on investment (ROI) for each campaign. | Avg (ROI) group by Campaign Name | Mass Market or Major Donor and Mass Market |