You are here:
Custom Four-Column Table
Table visuals are useful to list values of several items against some criteria. The fields you add to the source report chart are the ones available for the table columns in dashboards.
Tables show two columns of data by default. They can show totals and up to four columns of data if you customize. You can also personalize the table and show users’ Chatter photos as long as the table doesn’t have more than 20 rows.
Before you customize a table, make sure your source report is in matrix or summary format and contains a chart.
-
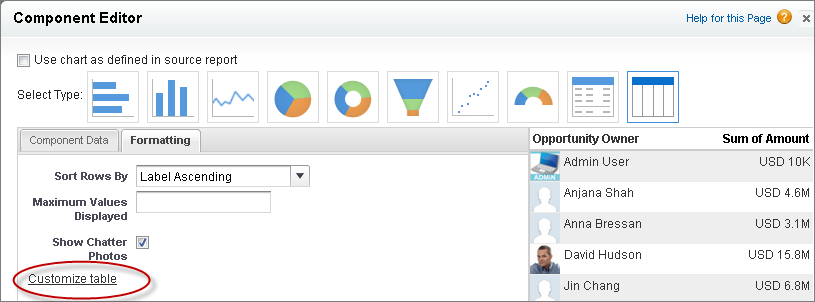
To create a four-column table, edit a table component on a dashboard and click the Customize Table link . Customized tables allow null values in the results. Default two-column tables do not.
-
Which fields you can use in the table depends on the fields you picked in the source report chart:
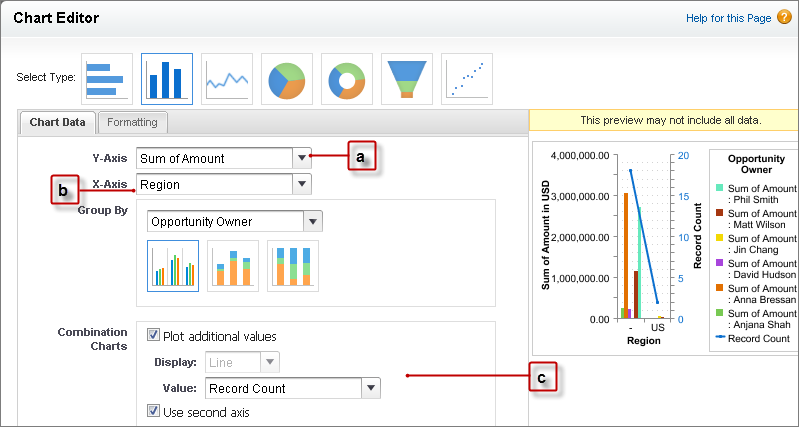
- The chart must contain groupings and at least one summary.
- The first grouping in the report chart becomes the first column of the table. To show a different field as the first column in the table, select the desired grouping in the report chart.
- Use a combination vertical bar or a scatter chart in the report to make more fields available for the table.
Example
You can use a table to show:
-
Top sales reps for the quarter with the number of opportunities each won.
-
Number of cases by product in the last three months.
-
Number of accounts by region, the total number of opportunities available, and those won.
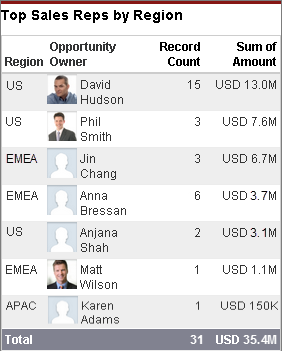
Look at this customized four-column table that shows the top sales reps by region with the number and value of opportunities they won.