Analyze Data with Agent Optimization
Use Agent Optimization to drill into sessions, analyze quality scores, and identify patterns to improve your agent's performance.
Required Editions
| Available in: Enterprise, Performance, and Unlimited Editions with an Einstein for Sales, Einstein for Platform, Einstein for Service, Einstein 1 Service, or Einstein GPT Service add-on. To purchase add-ons, contact your Salesforce account executive. |

| Access and view Agentforce Optimization | Assign the Access Agentforce Optimization and Data Cloud User permission sets |
Agent Optimization helps you analyze both voice and chat sessions, view raw and processed session data, filter by modality, and track quality scores to improve your agent's performance.

In Agentforce Studio, under Optimization, select Insights.
Use the Insights view for a view of key metrics to help you monitor your agent's overall performance. Use the filters to view data by agent and modality type (Voice, Chat, or All).
Insights Dashboard
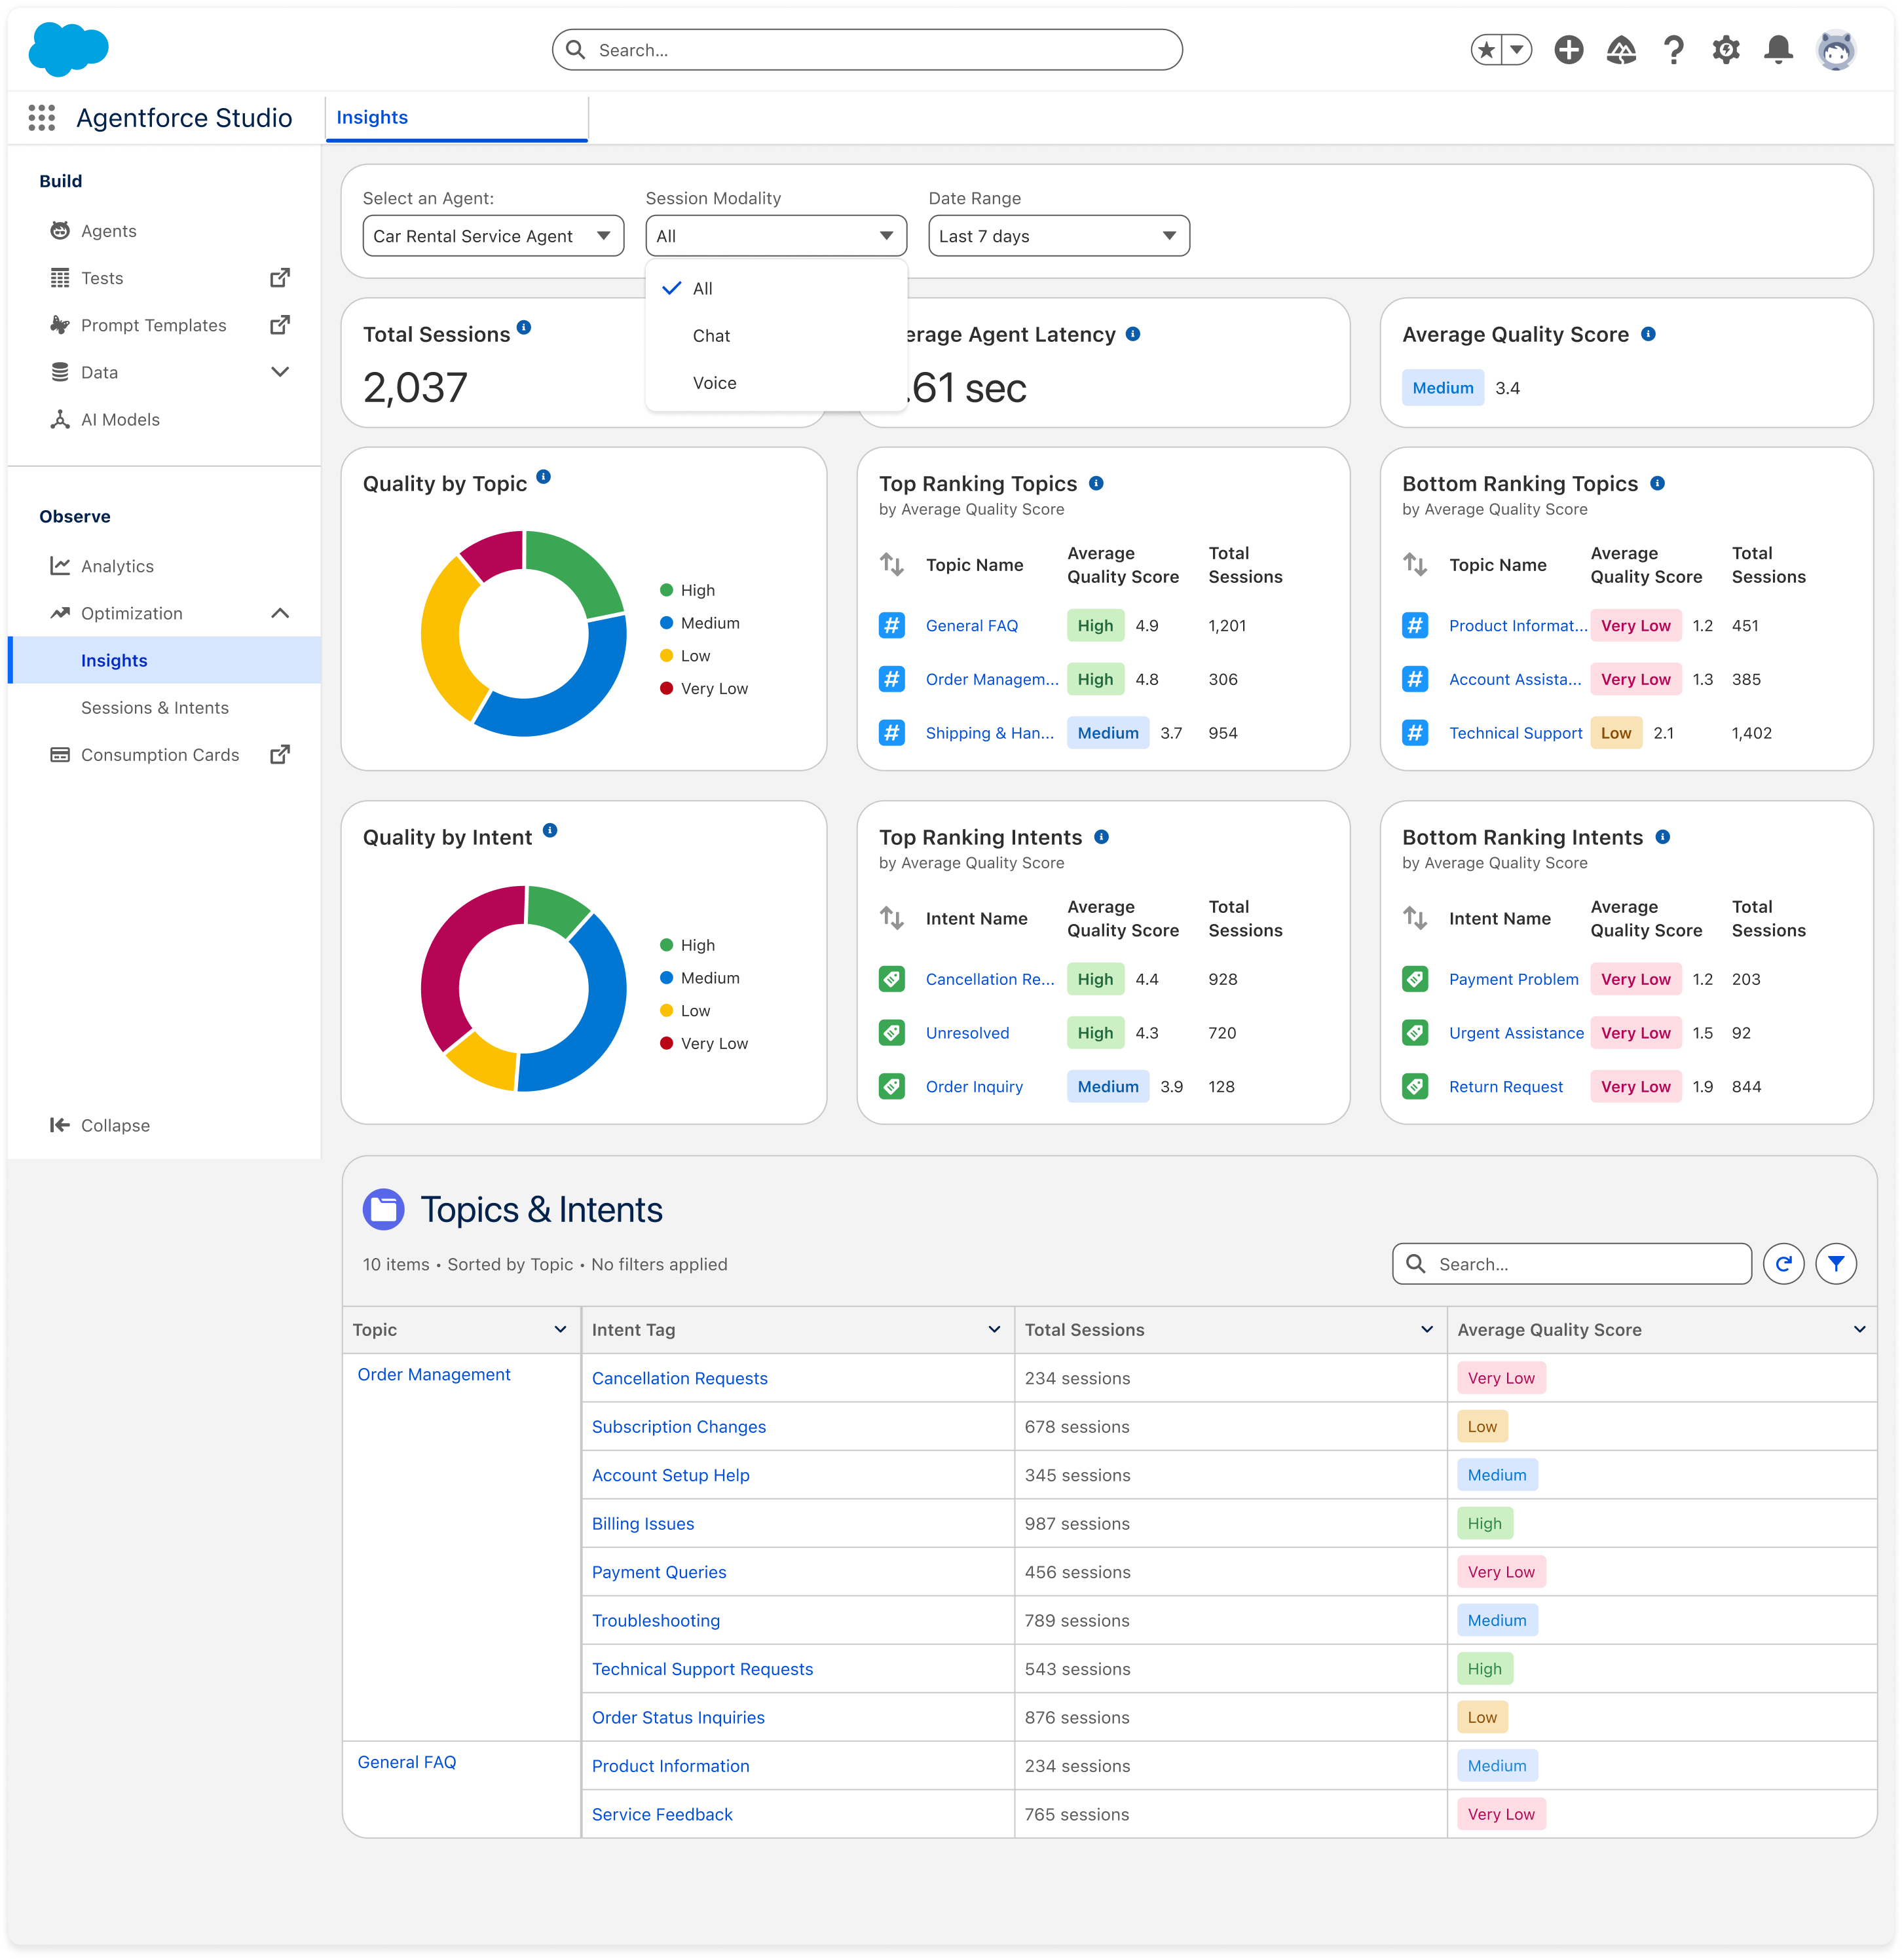
The dashboard provides a comprehensive view of your agent's effectiveness, including:
- Performance metrics including Total Sessions, Average Agent Latency, and Average Quality Score. Total Sessions shows the total count of all sessions, including sessions with complete insights and those still processing. Quality scores are calculated by an external LLM that evaluates how well your agent responds to user requests on a scale from 1 (lowest) to 5 (highest). This scoring system helps you identify which interactions need improvement and track your agent's performance over time.
- Visualizations of how quality scores are distributed across subagents and intents, helping you identify which areas your agent handles well and which need improvement.
- View of top and bottom performing subagents and intents ranked by quality score. For example, you might see that your agent excels at handling contact record summaries but struggles with general inquiries.
Work with the Sessions and Intents Page
Go to the Sessions & Intents page to filter, analyze, and export session data for both voice and chat interactions.
The page provides powerful tools to analyze your agent's interactions and is divided into Processed and Unprocessed Sessions. Key metrics populate the columns including Intent Summary, Response Summary, Intent Tags, Quality Score, actions performed by the agent, and more.
- Filter sessions by modality: Use the modality filter to view sessions by type: Voice, Chat, or All Modalities.
- Processed and Unprocessed Sessions: The page is divided into two
distinct views. Processed Sessions have passed through the optimization pipeline, where
the system extracts and analyzes customer intents for insights and assigns quality scores.
Unprocessed Sessions have not yet gone through the pipeline and may include active sessions or
recently closed sessions. For more information about intent processing, see Use Intents in Agent
Optimization.
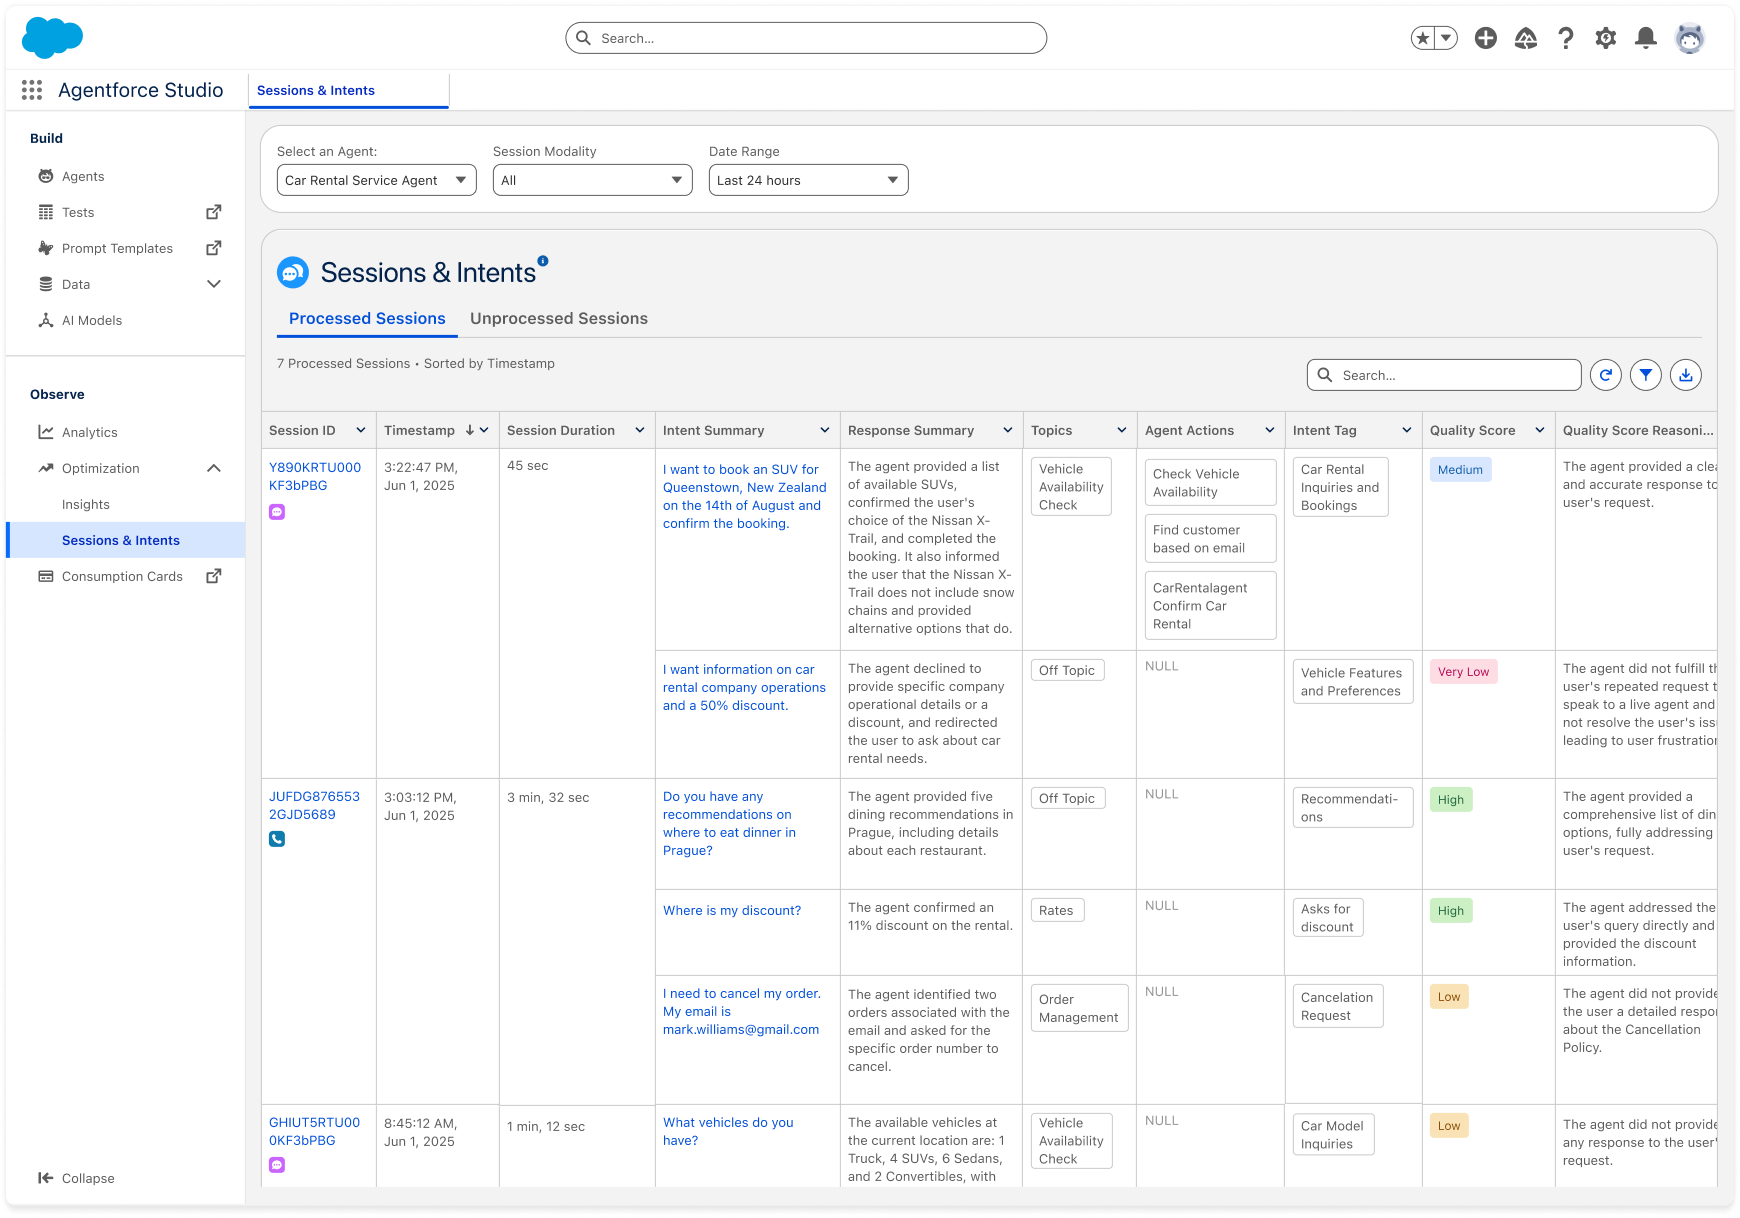
- Session Timeframe Range: View and filter sessions from the last 24 hours.
- Transcript Export: Download transcripts for all sessions currently filtered in the table.
- Duration Metrics: Track performance via duration metrics. Chat logs
display a total session duration at the top and specific duration calculations for every agent
response. Processing Time signals show how long the agent took to process
each request, including time spent reasoning (understanding and planning) and taking actions
(executing actions). Note Duration metrics are currently only available for Chat sessions.
Review Voice Sessions
Drill into voice sessions to listen to recordings and analyze voice-based interactions.
Agent Optimization supports voice agents. You can drill into any voice session and listen to the recording using the integrated audio player directly from the Sessions page.
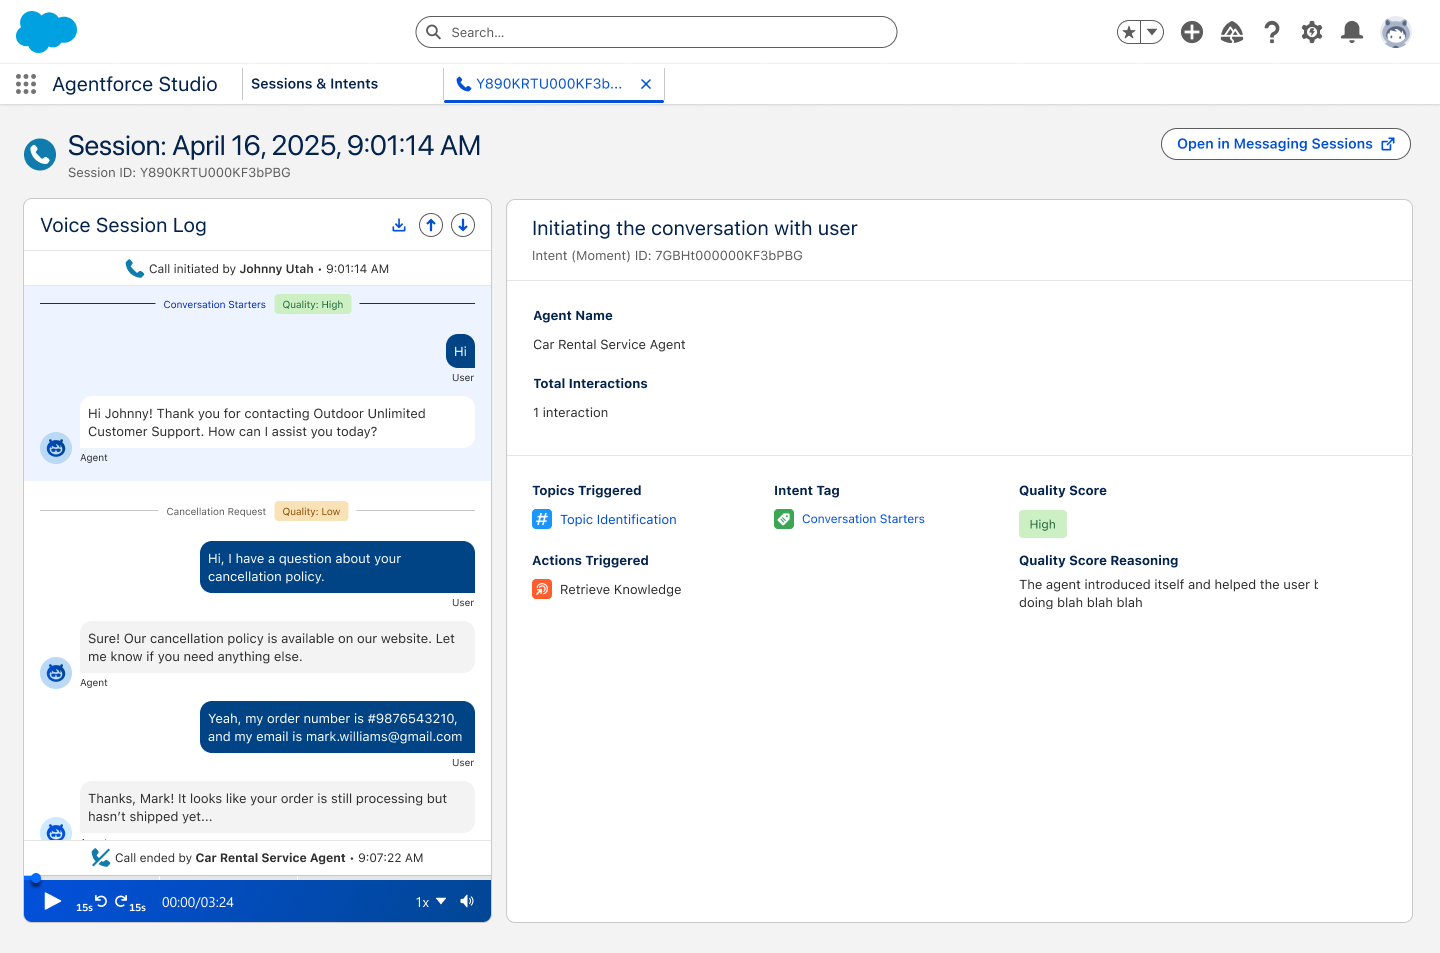
Click into any session to view its data and play back audio for voice-based interactions. The voice session trace displays the complete conversation transcript alongside the audio playback controls.
Dive into Specific Intents
From the Processed Sessions tab, you can drill into specific intents to identify patterns and opportunities in your agent's interactions.
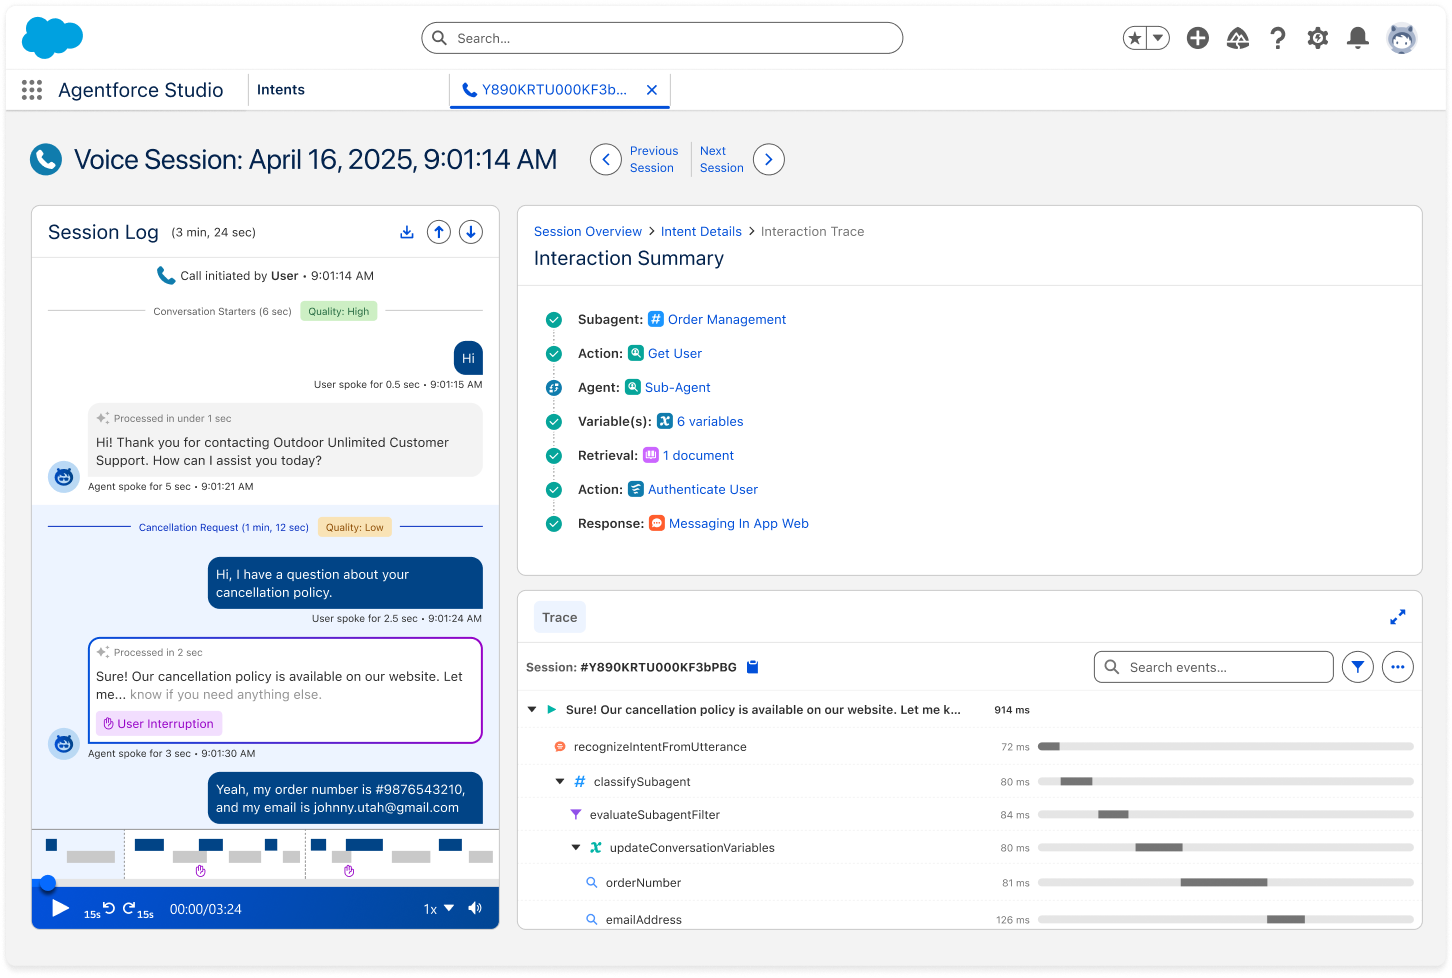
The table displays key metrics for each interaction including Intent Summary, Response Summary, Intent Tags, Quality Score, actions performed by the agent, and more. You can also view intents and their performance in the session trace on the Session Page.
The session trace shows a session flow breakdown: each session is broken down into intents, and each intent is associated with the cluster tag assigned by the clustering pipeline. Use intent tags to group and compare similar user requests across sessions, identify high-volume patterns, and prioritize improvements. To understand how tags are generated, see Intent Analysis and Clustering.
Debug and Optimize from the Session Page
Deep-dive into specific interactions to understand what happened during user conversations and identify areas for improvement.
Click on a session to open the Session Page and deep-dive into that specific interaction. The Session Page shows you exactly what happened during a user's conversation with your agent, helping you understand and fix issues.
Session Page Overview
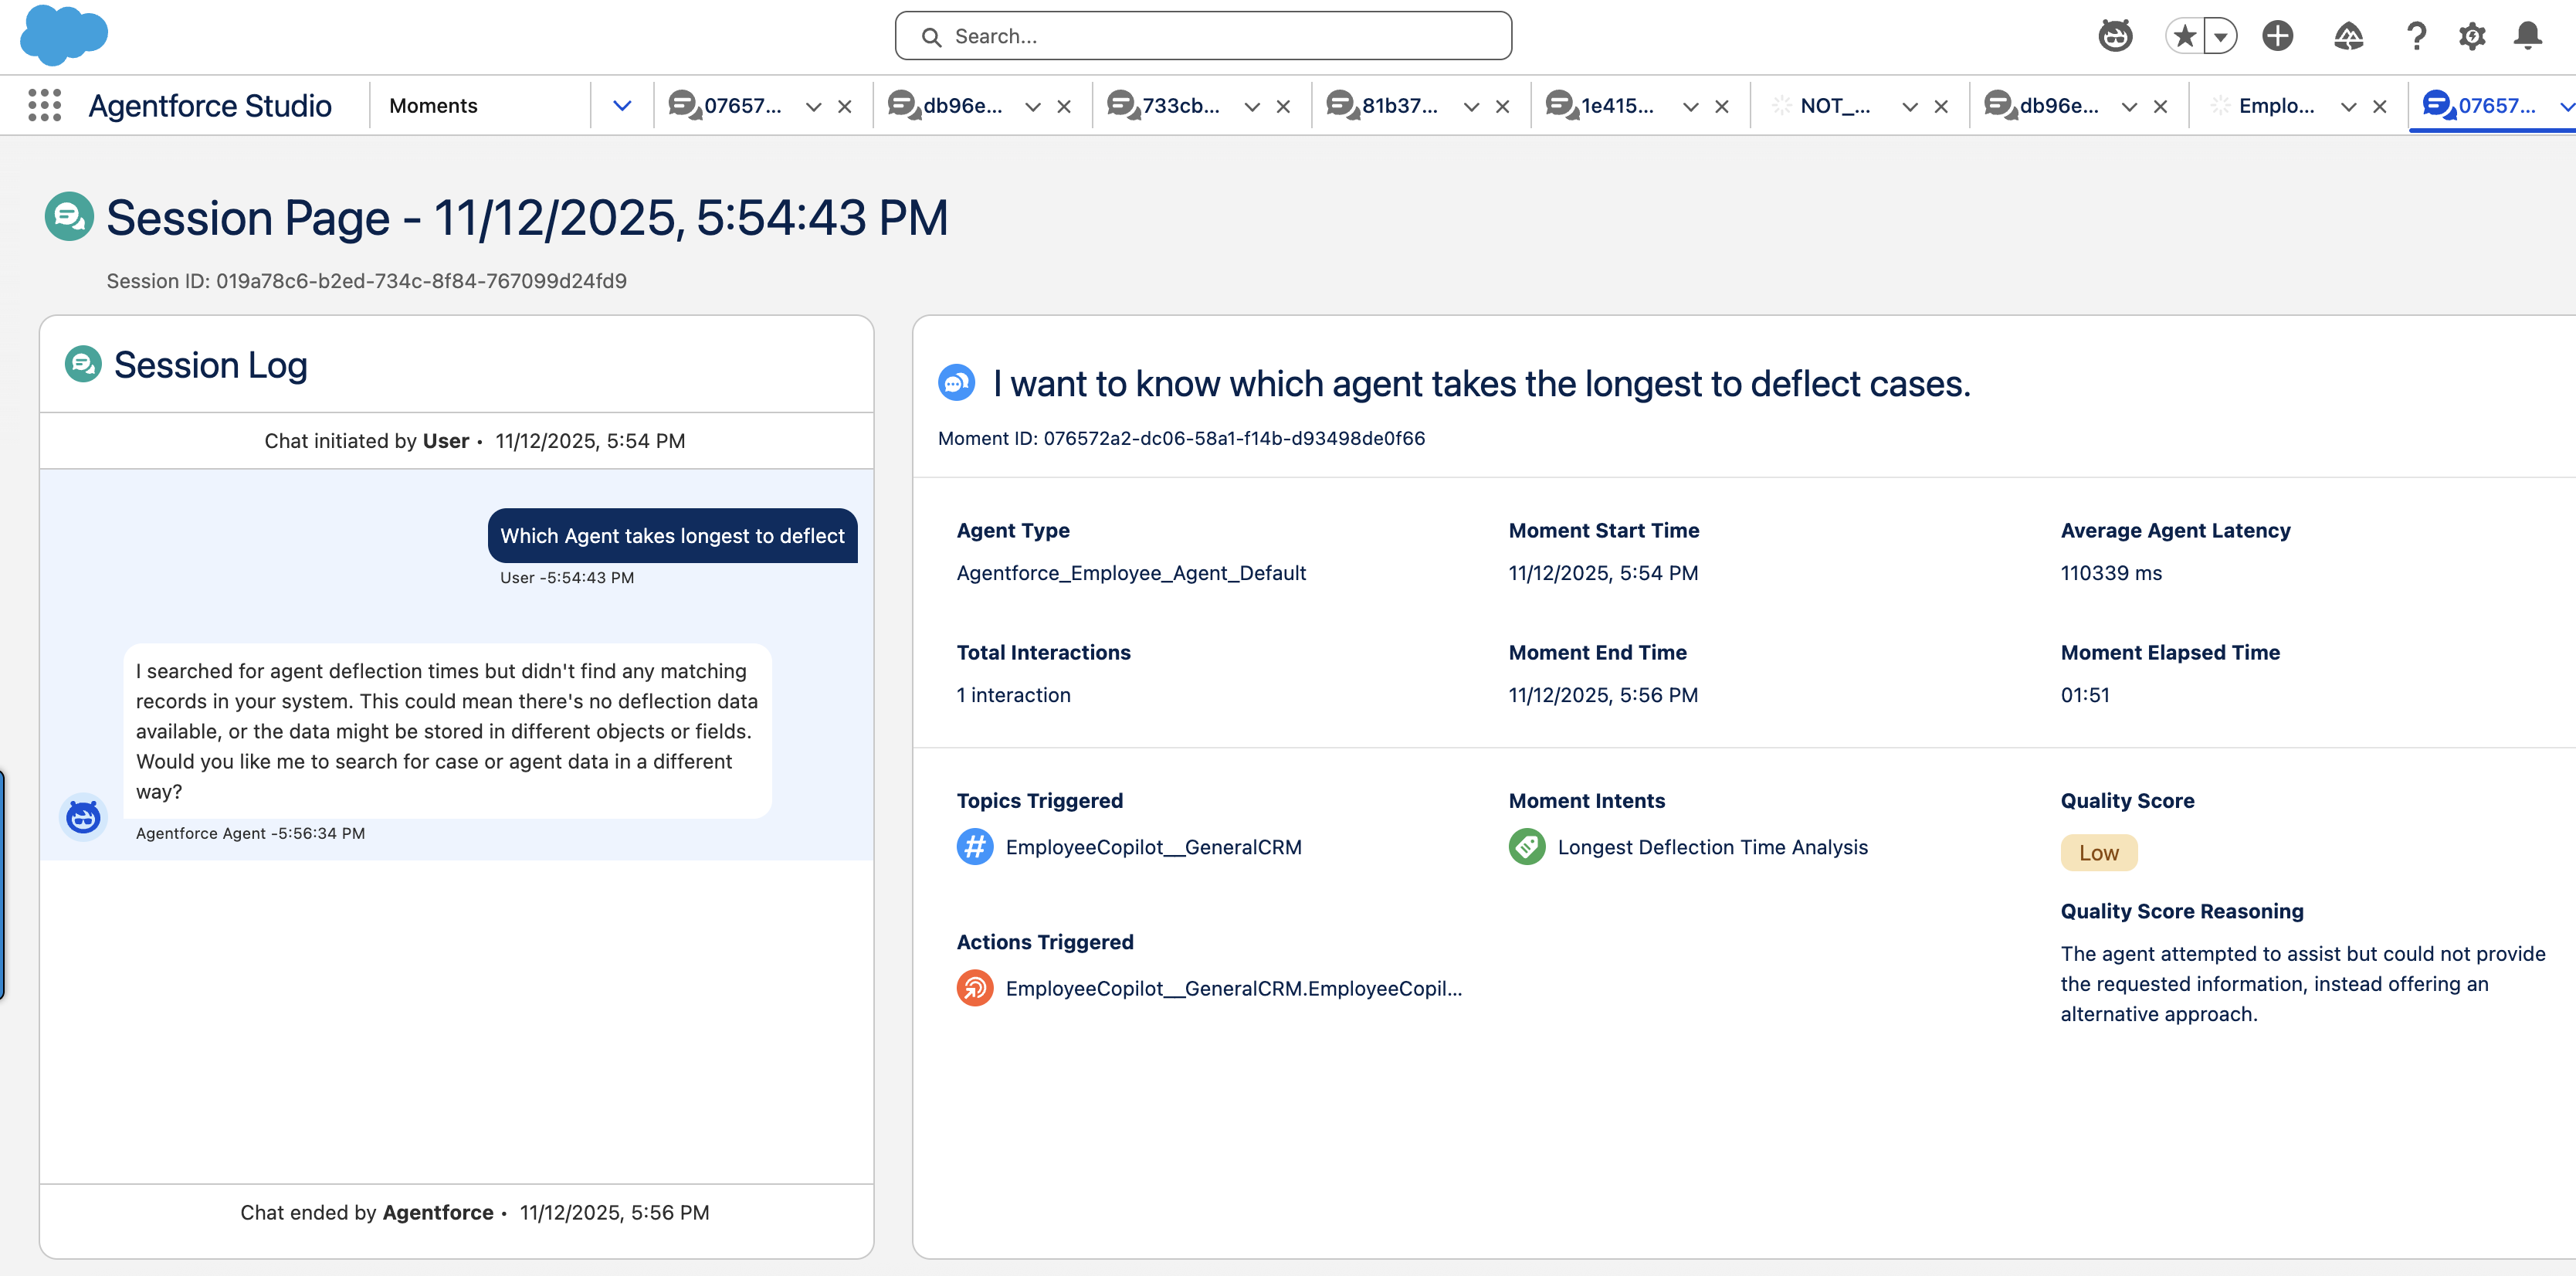
Use the Interaction Summary for a concise view of the interaction, then open the Trace tab to follow what happened in order. Tracing shows a time-ordered record of processing steps and their duration, so you can see where work ran, how long each part took, and where to look when behavior or performance does not match what you expect.
When a user initiates a request, the agent analyzes intent and runs the sequence of actions configured to handle it. The trace reflects that work as distinct steps—for example intent handling, subagent routing, filters, retrievals, variable updates, and action execution—so you can compare what appears in the UI with what you defined in Agentforce Builder. Admins can configure subagents with specialized actions, including delegation to other agents in Single Org, Multi-Agent (SOMA) setups. When delegation occurs, expand the trace step where the subagent was invoked to drill into nested steps.
Session Page with Interaction Summary and Trace
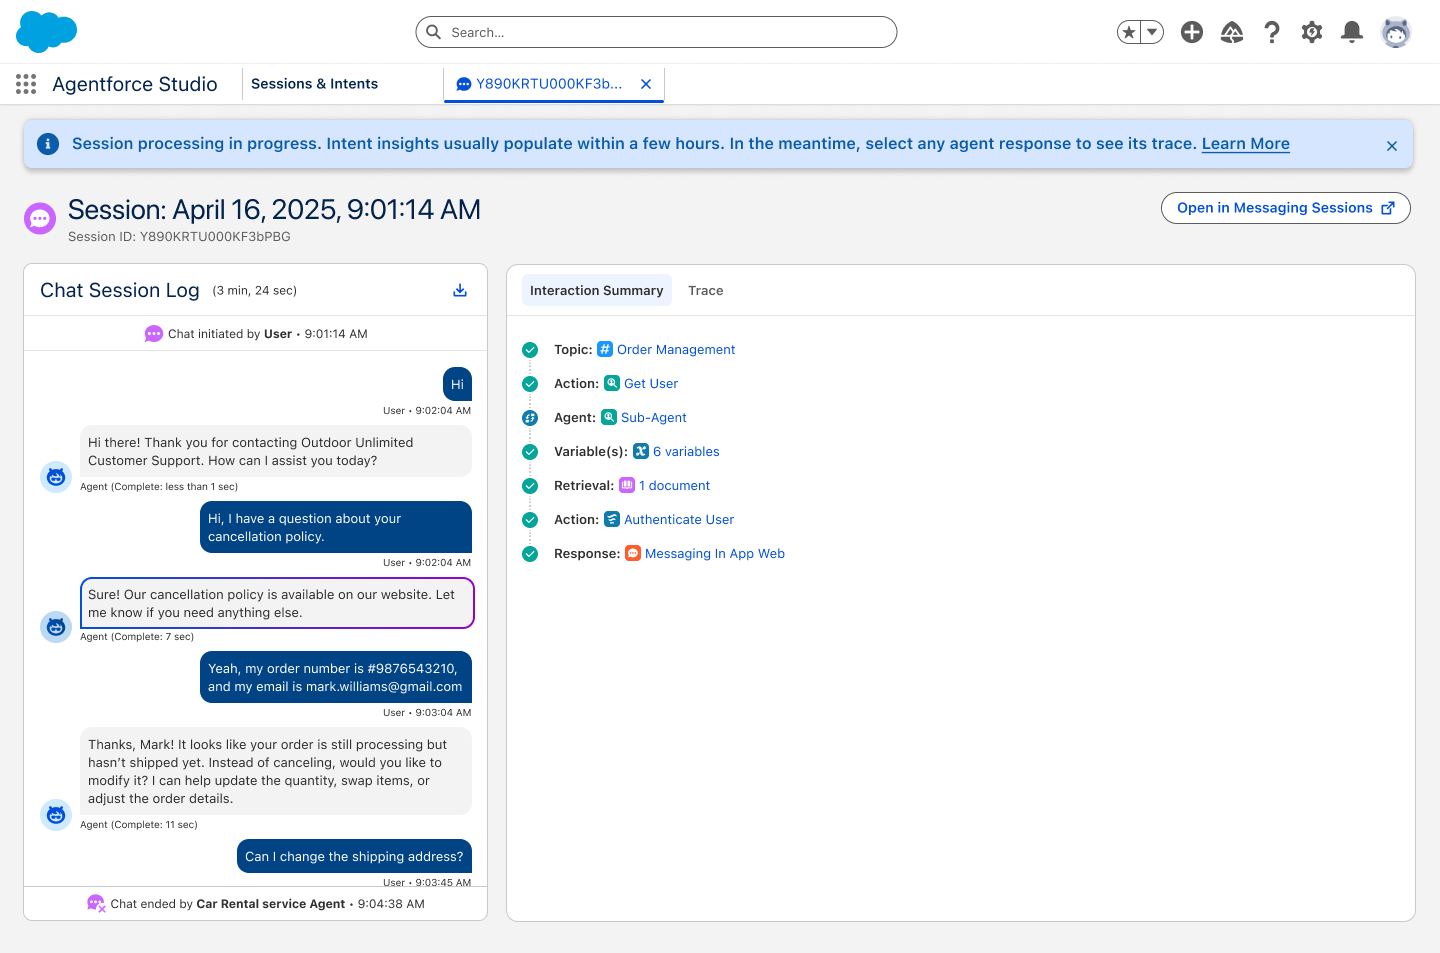
Unprocessed Session View: For sessions still active or those that haven't completed the intent pipeline, you see a "Session processing in progress" banner. Switch to the Trace tab to view the full session trace.
Unprocessed Session View
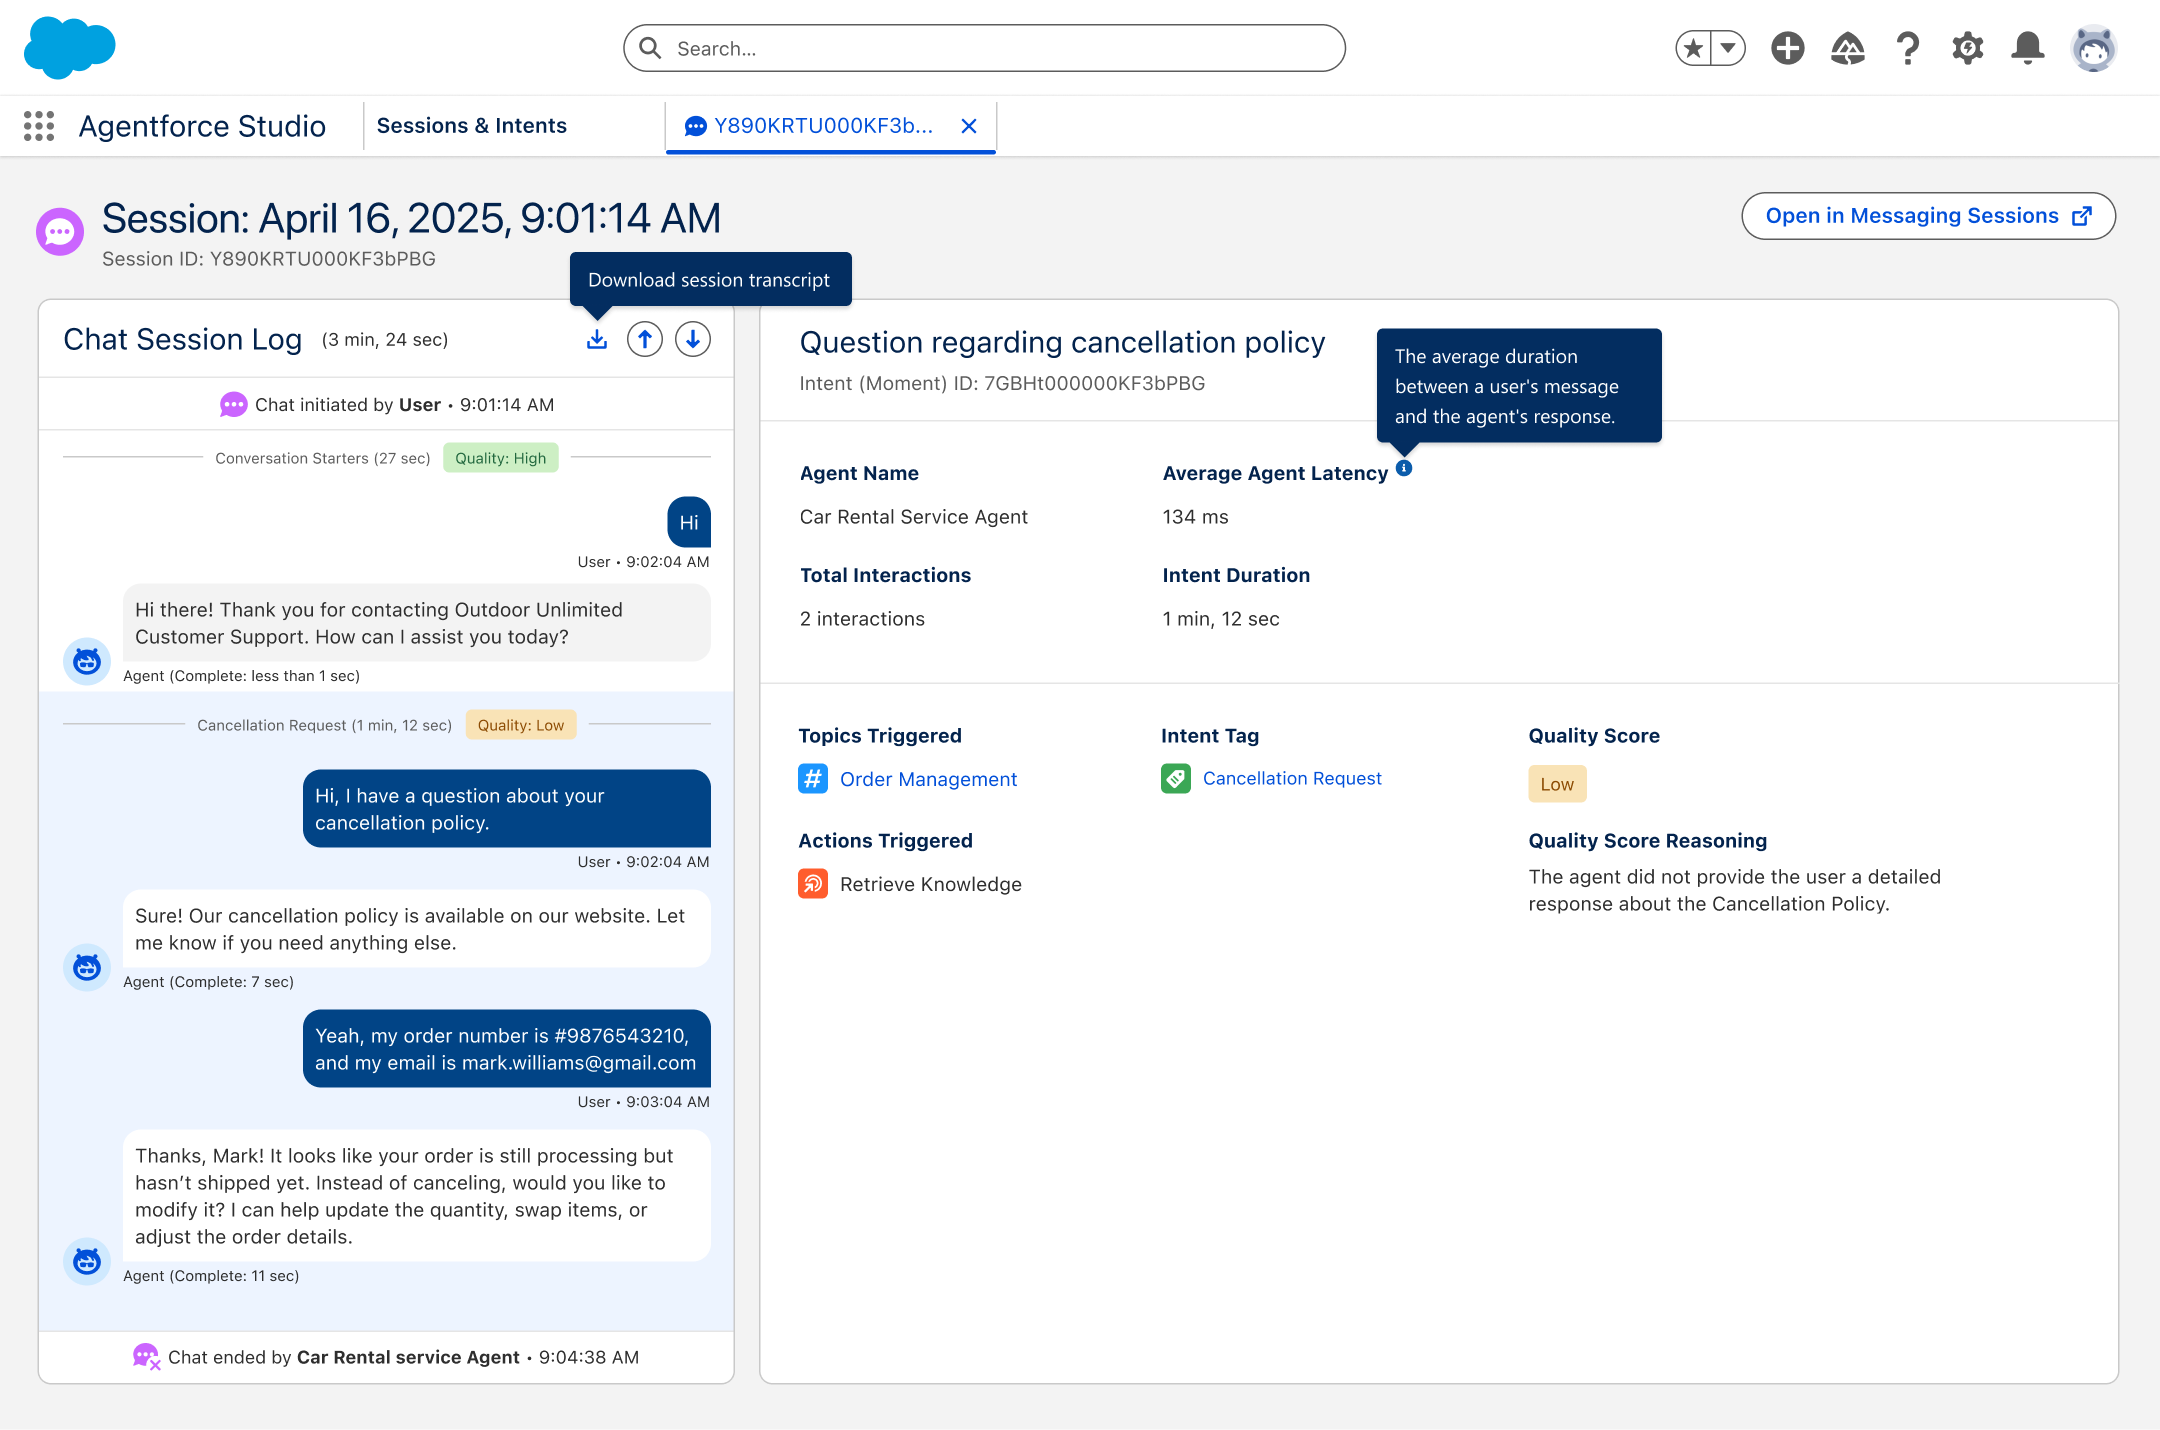
Processed Session View: Once processing completes, the session trace displays intents with quality score indicators. Click on an intent to view performance metrics, triggered subagents and actions, and quality score reasoning.
Processed Session View