
You are here:
Sales Analytics Team Benchmark Dashboard
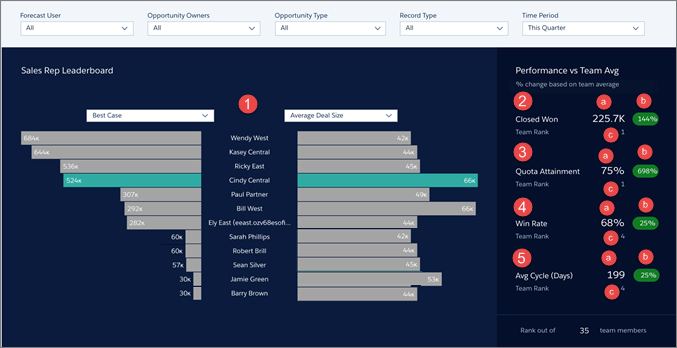
Shows a ranking of sales rep results across your team’s KPIs, such as closed won deals, best case, and average deal size. Also shows each rep’s performance against team average.
Required Editions
| User Permissions Needed | |
|---|---|
| To use CRM Analytics apps: | Use CRM Analytics Templated Apps |
| To use Sales Analytics: | Access Sales Cloud Analytics Templates and Apps |
| To create and manage CRM Analytics apps: | Manage CRM Analytics Templated Apps |
| Edit CRM Analytics Dataflows | |
Default Behavior and Recommended Options
Select two KPIs in the main (bar) chart (1) to compare one measure of performance against another. Both selectors contain the same KPIs so you can compare whatever is on the left with whatever is on the right. The rank order of your team sorts according to the measure selected on the left.
Select a specific rep to view their scorecards in the right column, which also shows the rep’s team rank. Team is defined by all the reps that show up in the bar chart, depending on what you select in the Forecast User/Manager Role filter (Forecast User in image).
Wizard and Other Setup Options
Forecast User/Manager Role filter (Forecast User in image). If Salesforce is set up to use the Salesforce Forecasting feature in Sales Cloud, the filter shows forecast usernames. If your org doesn’t use forecasting, filter shows role developer names. In either case, pipe rolls up to the selected user. If your org doesn’t use Salesforce role hierarchy, this filter does not appear.
Opportunity Type filter. Values shown determined by selection made in wizard page 5, question 3. By default, the filter uses the standard Opportunity Type field.

Time Period filter. All time periods based on Salesforce fiscal year setting.
Supports Opportunity Splits if the feature is enabled in your org. See Opportunity Splits.
Datasets Used
- Opportunities (or Opportunity Splits)
- User Manager
- User Allocation
- Activities
KPI Calculations
All KPIs appear in the right-hand column.
- Closed Won (2a). Total amount closed won based on a selected time period, which can include future opportunities.
- Closed Won Comparison (2b). (Total amount closed won for selected time period to date [for owner selected in main chart (1)] - Average total amount closed won for team during the same period) / Average total amount closed won for all team members during the same period. Comparative value appears only if you select a sales rep in main chart (1), otherwise you see 0.
- Closed Won Team Rank (2c). Rank of rep selected in the main chart (1) based on closed won business in the selected time period. Rank based on opportunity owners who roll up to the manager selected in Forecast User filter as well as the owners selected in Opportunity Owner filter. Rank appears only if you select a sales rep in main chart (1), otherwise you see a 1.
- Quota Attainment (3a). Closed Won / Quota Amount based on a selected time period, which can include future opportunities.
- Quota Attainment Comparison (3b). (Quota attainment for rep selected in main chart (1) - Quota attainment for team) / Quota attainment for team. Comparative value appears only if you select a sales rep in main chart (1), otherwise you see 0.
- Quota Attainment Team Rank (3c). Rank of rep selected in main chart (1) based on quota attainment in the selected time period. Rank based on opportunity owners who roll up to manager selected in Forecast User filter as well as the owners selected in Opportunity Owner filter. Rank appears only if you select a sales rep in main chart (1), otherwise you see a 1.
- Win Rate (4a). Total amount won / Total amount closed (Won or Lost) based on selected time period, which can include future opportunities.
- Win Rate Comparison (4b). (Win rate for the owner selected in main chart (1) - Win rate for team) / Win rate for team. Comparative value appears only if you select a sales rep in main chart (1), otherwise you see 0.
- Win Rate Team Rank (4c). Rank of rep selected in main chart (1) based on their win rate in the selected time period. Rank based on opportunity owners who roll up to the manager selected in Forecast User filter as well as the owners selected in Opportunity Owner filter. Rank appears only if you select a sales rep in main chart (1), otherwise you see a 1.
- Avg Sales Cycle (5a). Number of days from CreatedDate in the selected time period, which can include future opportunities.
- Avg Sales Cycle Comparison (5b). (Sales cycle for rep selected in main chart (1) - Average sales cycle for team) / Average sales cycle for team. Comparative value appears only if you select a sales rep in main chart (1), otherwise you see 0.
- Avg Sales Cycle Team Rank (5c). Rank of rep selected in main chart (1) based on sales cycle in the selected time period. Rep with shortest sales cycle receives top ranking. Rank appears only if you select a sales rep in main chart (1), otherwise you see a 1.
