
You are here:
Show Tabular Information with a Lightning Table
Show up to 200 records and 10 columns and from any field in a source report’s report type. After grouping data in a Lightning table, you can add measures (sum, average, minimum, and maximum) to the grouped data. If a Lightning table's source report has a summary formula column, then you can show it on the Lightning table.
Required Editions
| Available in: Lightning Experience |
| Available in: Essentials, Professional, Enterprise, Performance, Unlimited, and Developer Editions |
| User Permissions Needed | |
|---|---|
| To create dashboards: | Run Reports AND Create and Customize Dashboards |
| To edit and delete dashboards that you created: | Run Reports AND Create and Customize Dashboards |
| To edit and delete dashboards that you created in public folders: | Edit My Dashboards |
| To edit and delete dashboards that you didn’t create in public folders: | Manage Dashboards in Public Folders |
| To create, edit, and delete dynamic dashboards: | Manage Dynamic Dashboards |
Ungrouped Lightning tables display detail columns, but not measure or formula columns. Grouped Lightning tables display measure and formula columns, but not detail columns.
Detail columns show per-record information about each individual record. The available fields in a Lightning dashboard table come from the source report’s report type. You can show fields as detail columns in Lightning dashboard tables that aren’t included as columns in the source report.
Measure columns display either the sum, average, maximum, or minimum value of grouped records. Because measure columns are the result of mathematics, they're always based on numeric fields.
Formula columns let you show a summary formula column from the Lightning table's source report on the Lightning table. If a source report's summary formula column is evaluated at All Summary Levels or Grand Total Only, it's compatible with all Lightning tables. If a summary formula column is evaluated at Specific Groups, group data in the Lightning table the same way as the source report to show the formula column.
Reports support up to four groups, but Lightning tables support two groups. So, you can't add a formula column based on the third or fourth grouping of a report. Lightning tables with source reports grouped by both rows and columns only support formula columns based on the report's first-level row and column groupings.
To add a Lightning table to a dashboard, or to edit one:
- Create or edit a dashboard.
- Add or edit a widget. In the
Edit
Component window, click
 .
. - Choose which columns to add.
- Select a field to group by.
You can group the table by any field from the source report type. Group by a field even if it isn’t part of the report.
After grouping, detail columns disappear and measure columns appear. To display record-level detail columns again, ungroup the table by clicking X or
 .
. - To add a measure or formula column, choose a field from Add measure
column.... After adding a measure column, click it and choose up to four measures:
Sum, Average, Max, or
Min. You can't add measures to formula columns.Add up to 9 measure and formula columns. Remember, you can only measure numeric fields, so date, text, picklist, and Boolean fields aren’t available.
Formula columns are listed before measure columns. Formula columns are identifiable by the formula icon that appears before their name (
 ).
). Note
Note- The default measure column is record count. You can’t remove record count, but after
adding another measure column, you can hide it by clicking the eye icon
(
 ).
). - Lightning table dashboard widgets don't support unique counts.
- The default measure column is record count. You can’t remove record count, but after
adding another measure column, you can hide it by clicking the eye icon
(
- When satisfied with the Lightning table, click Add or Update.
- To save the dashboard, click Save.
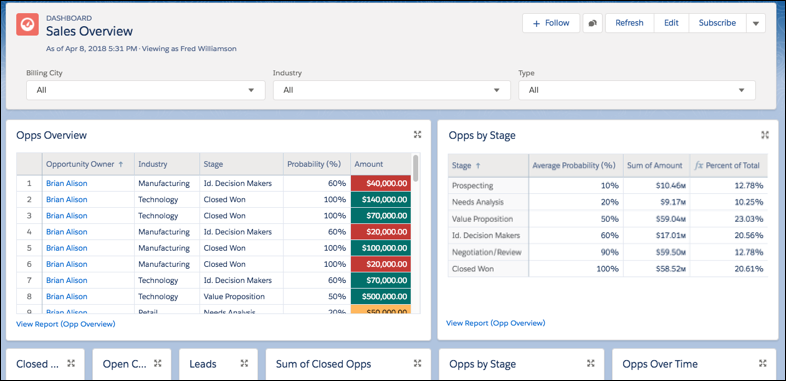
For example, as seen on the left-hand side of this Sales Overview dashboard, you can use a Lightning table to list details about individual opportunity records. The right-hand Lightning table, grouped by stage, provides a handy reference of key metrics like average probability and sum of amount. The right-most column is a formula column, showing percent of total.
- Show Subtotals on First-Level Groups in Lightning Tables
Lightning tables are a powerful tool for summarizing data on a dashboard. Second-level groups automatically show subtotals for each measure column. Show subtotals to add subtotals for each measure column to first-level groups.