You are here:
Customize Report Views in the Run Page
Use the power of Lightning Experience when you review and analyze your report records in the run page.
Required Editions
| Available in: Lightning Experience |
| Available in: Essentials, Group, Professional, Enterprise, Performance, Unlimited, and Developer Editions |
| Available in: Enhanced Folder Sharing |
| User Permissions Needed | |
|---|---|
| To run reports: | Run Reports |
| To run reports in shared folders: | Run Reports AND Access to the shared folder |
Review key report metrics in the header of the report run page in Lightning Experience. The Lightning Experience report header displays up to 8 metrics, in the order that they appear in the report, from left to right. These metrics include summaries such as average amounts, grand totals, subtotals, record counts, and formula column results.
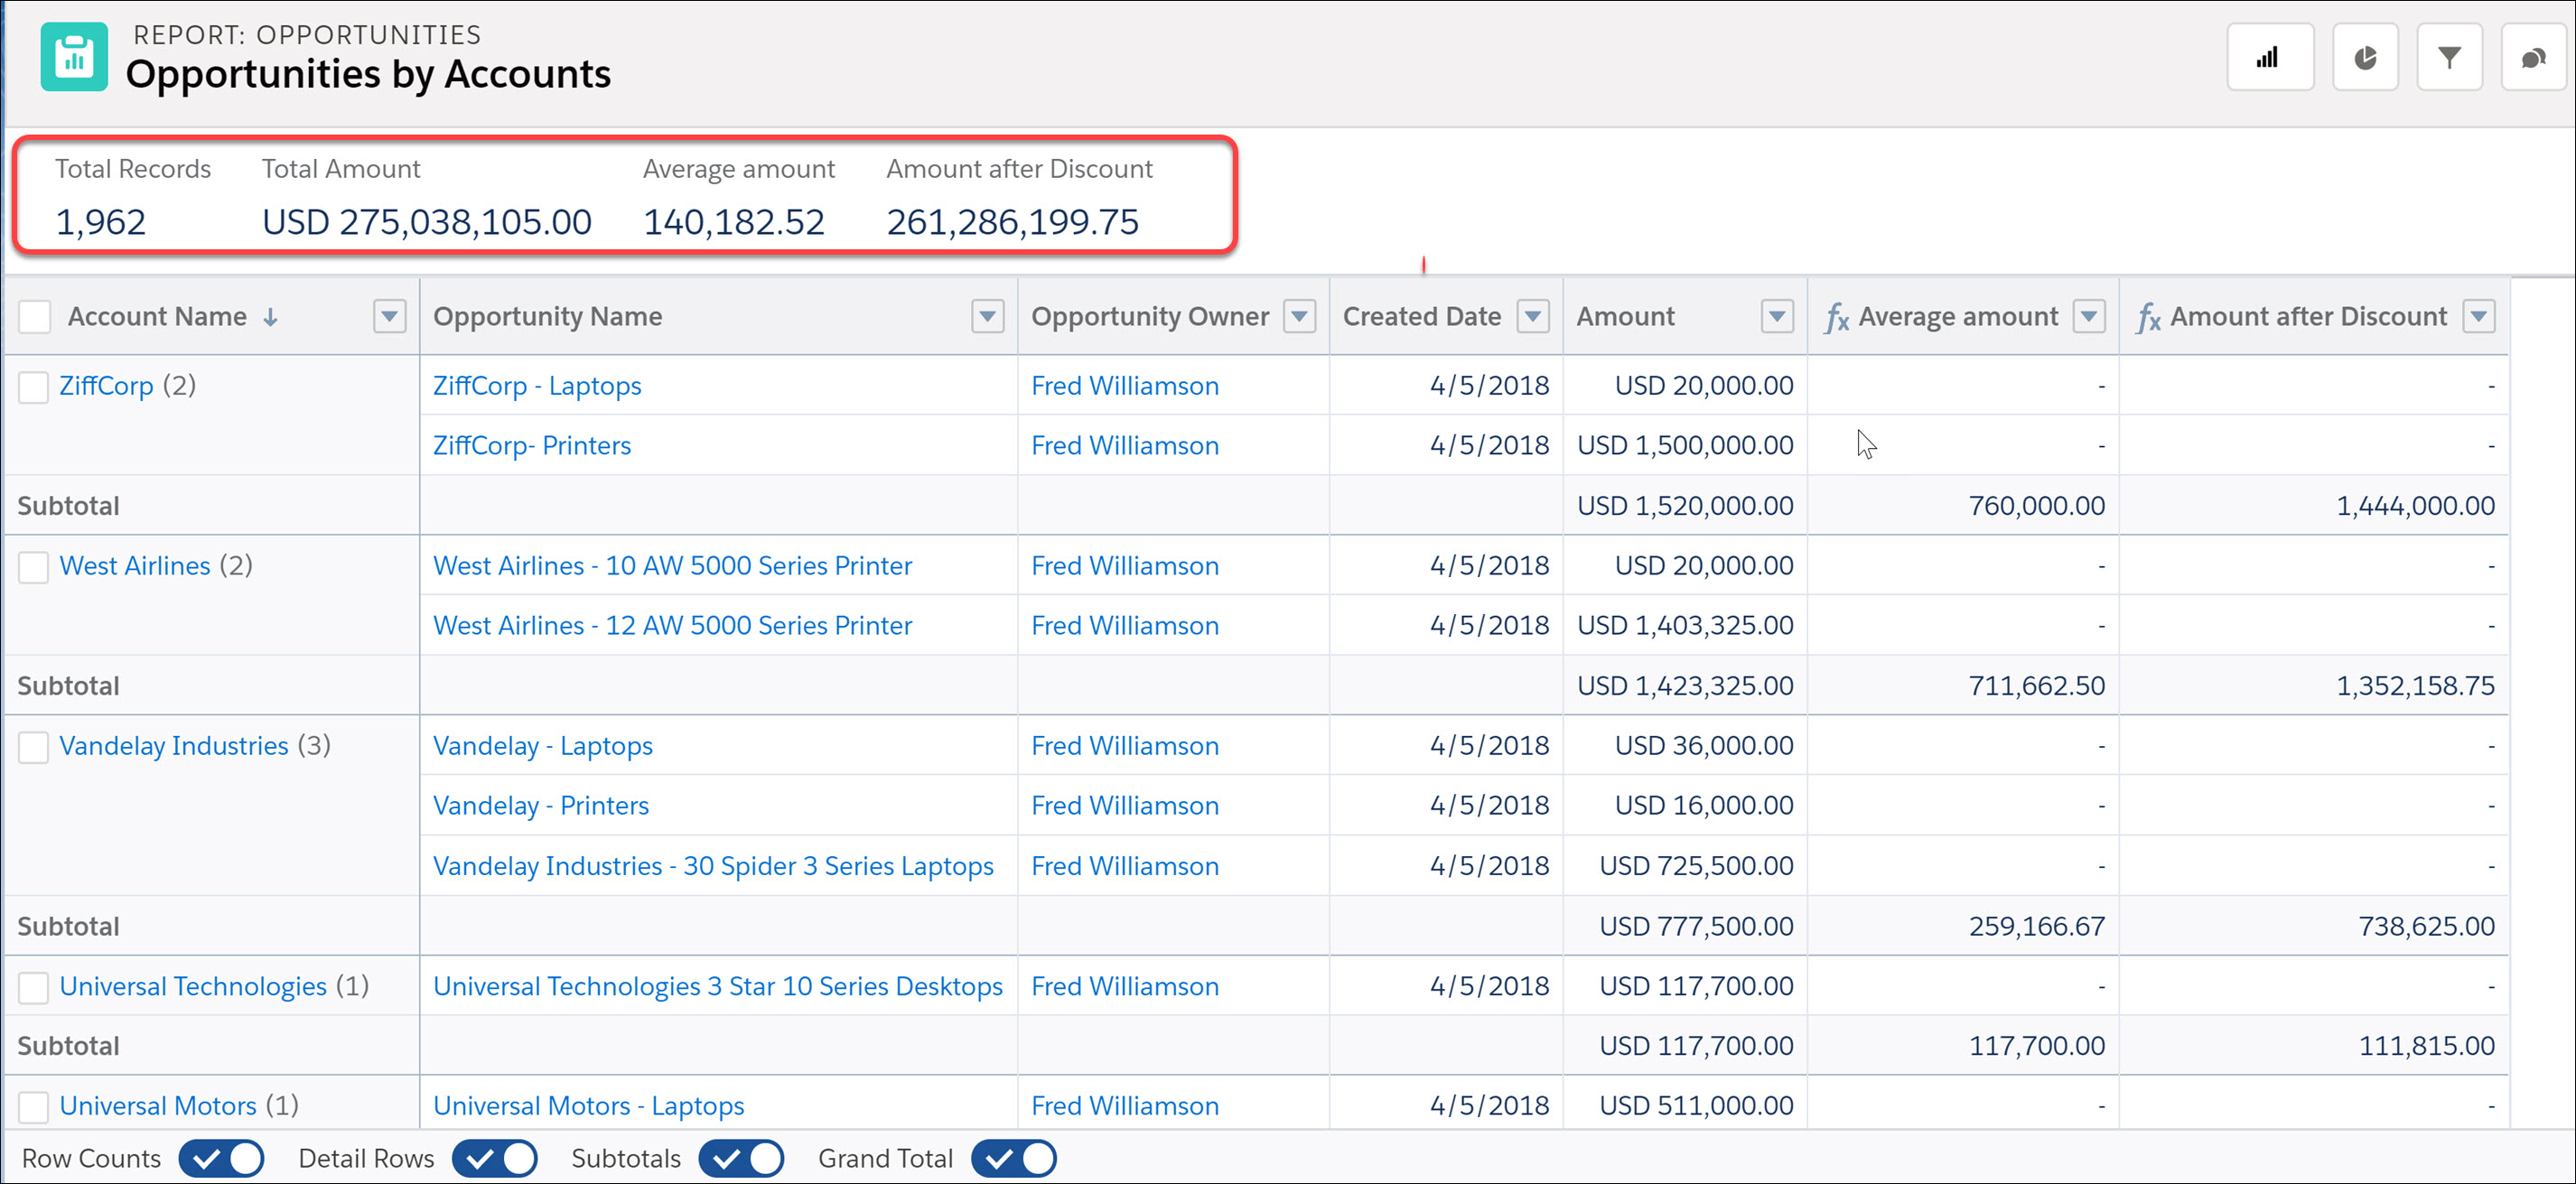
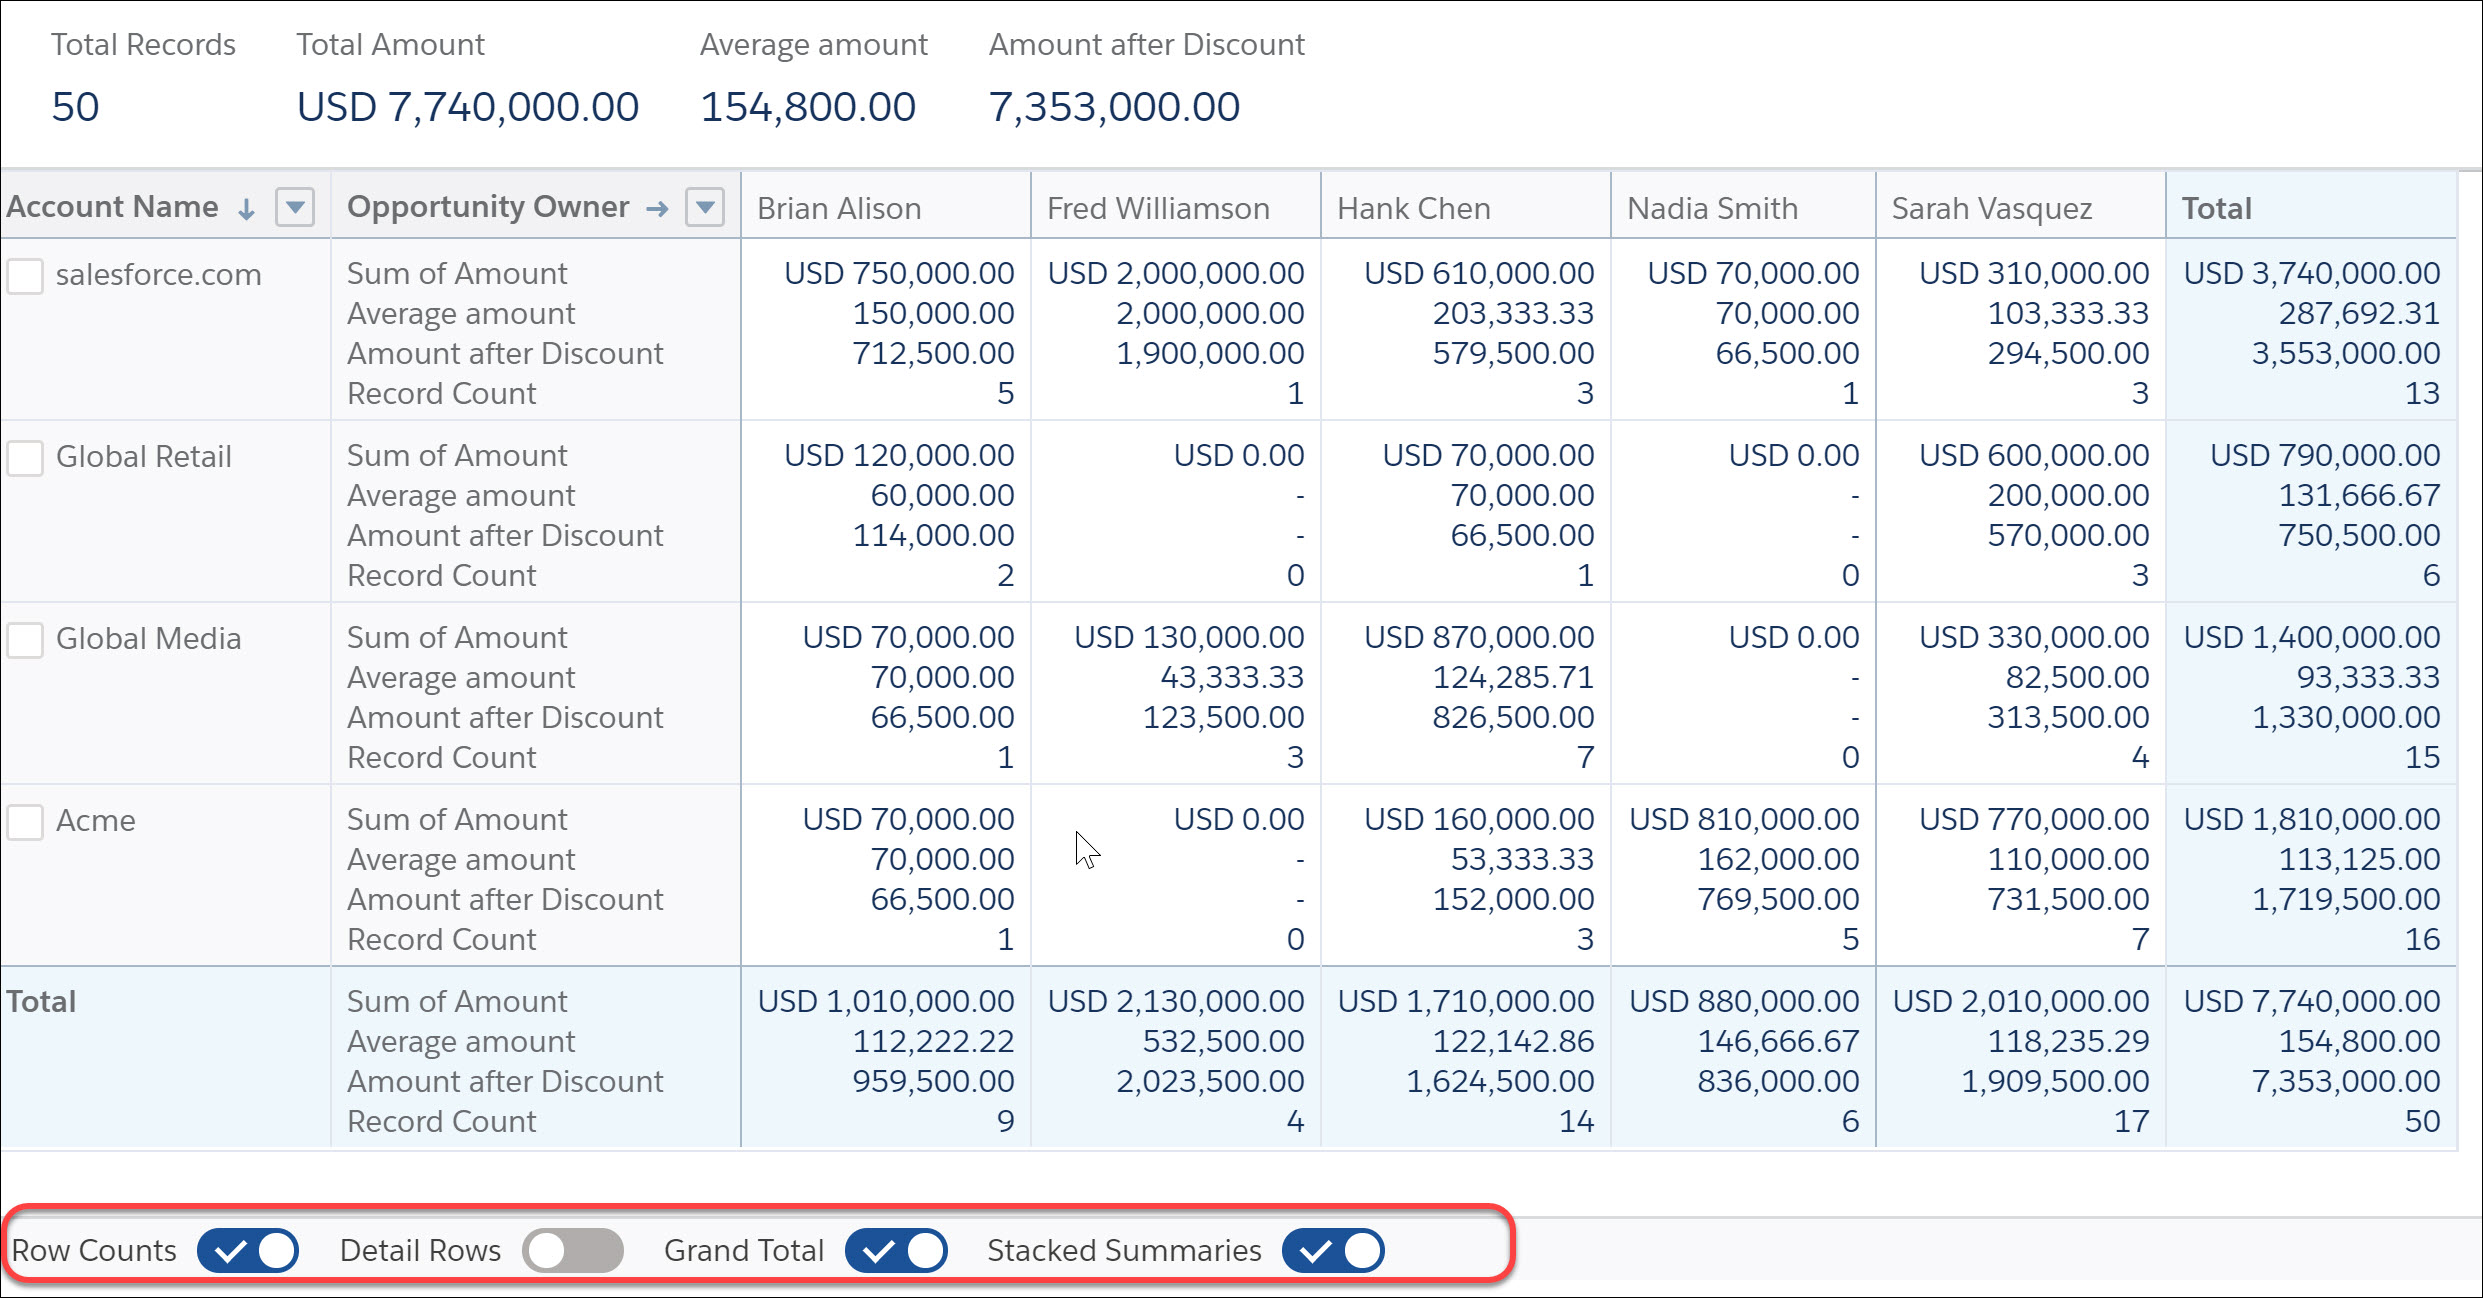
To quickly view or hide a report’s count of rows, detail rows, subtotals, or grand total record, use the toggles in the report footer. For reports grouped by rows and columns (matrix), the footer includes the option to switch between stacked and unstacked summaries view. Stacked summaries appear together, whereas unstacked summaries appear in distinct columns.
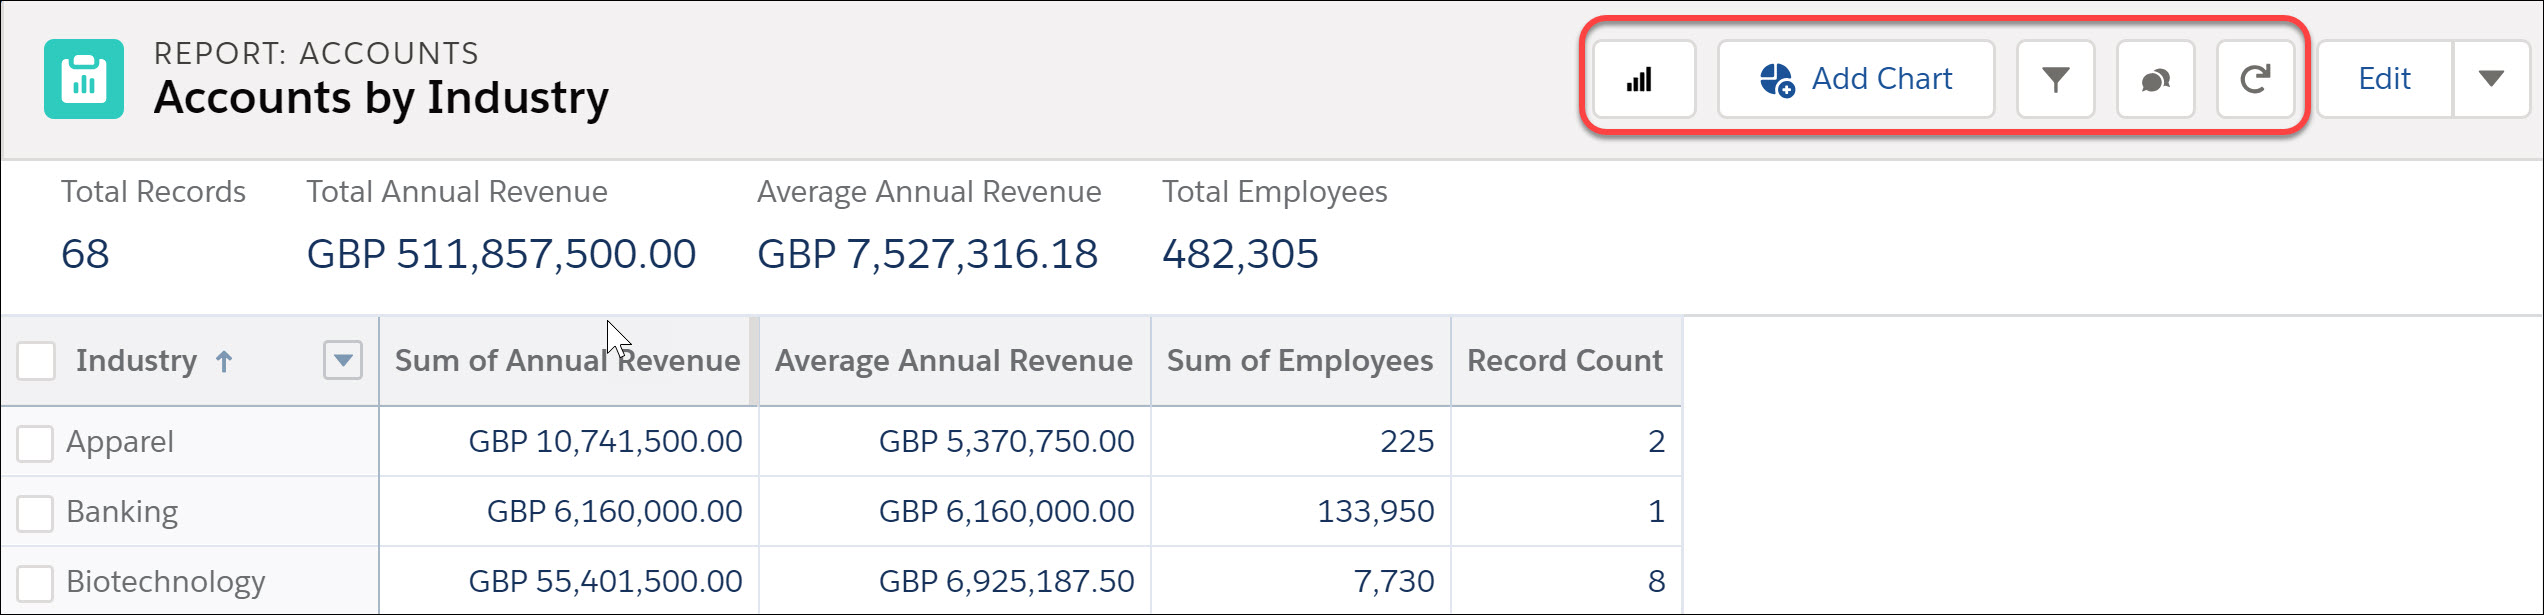
Get even more done with the tools in the report header. Using the tools, you can:
- trend a report (available with CRM Analytics license)
- show or hide a chart
- add, remove, or modify report filters
- collaborate with others on the report feed
- refresh the report
Viewing jumbo-sized reports in the run page? Column headers are sticky, so, they don’t go out of sight as you page through report records.
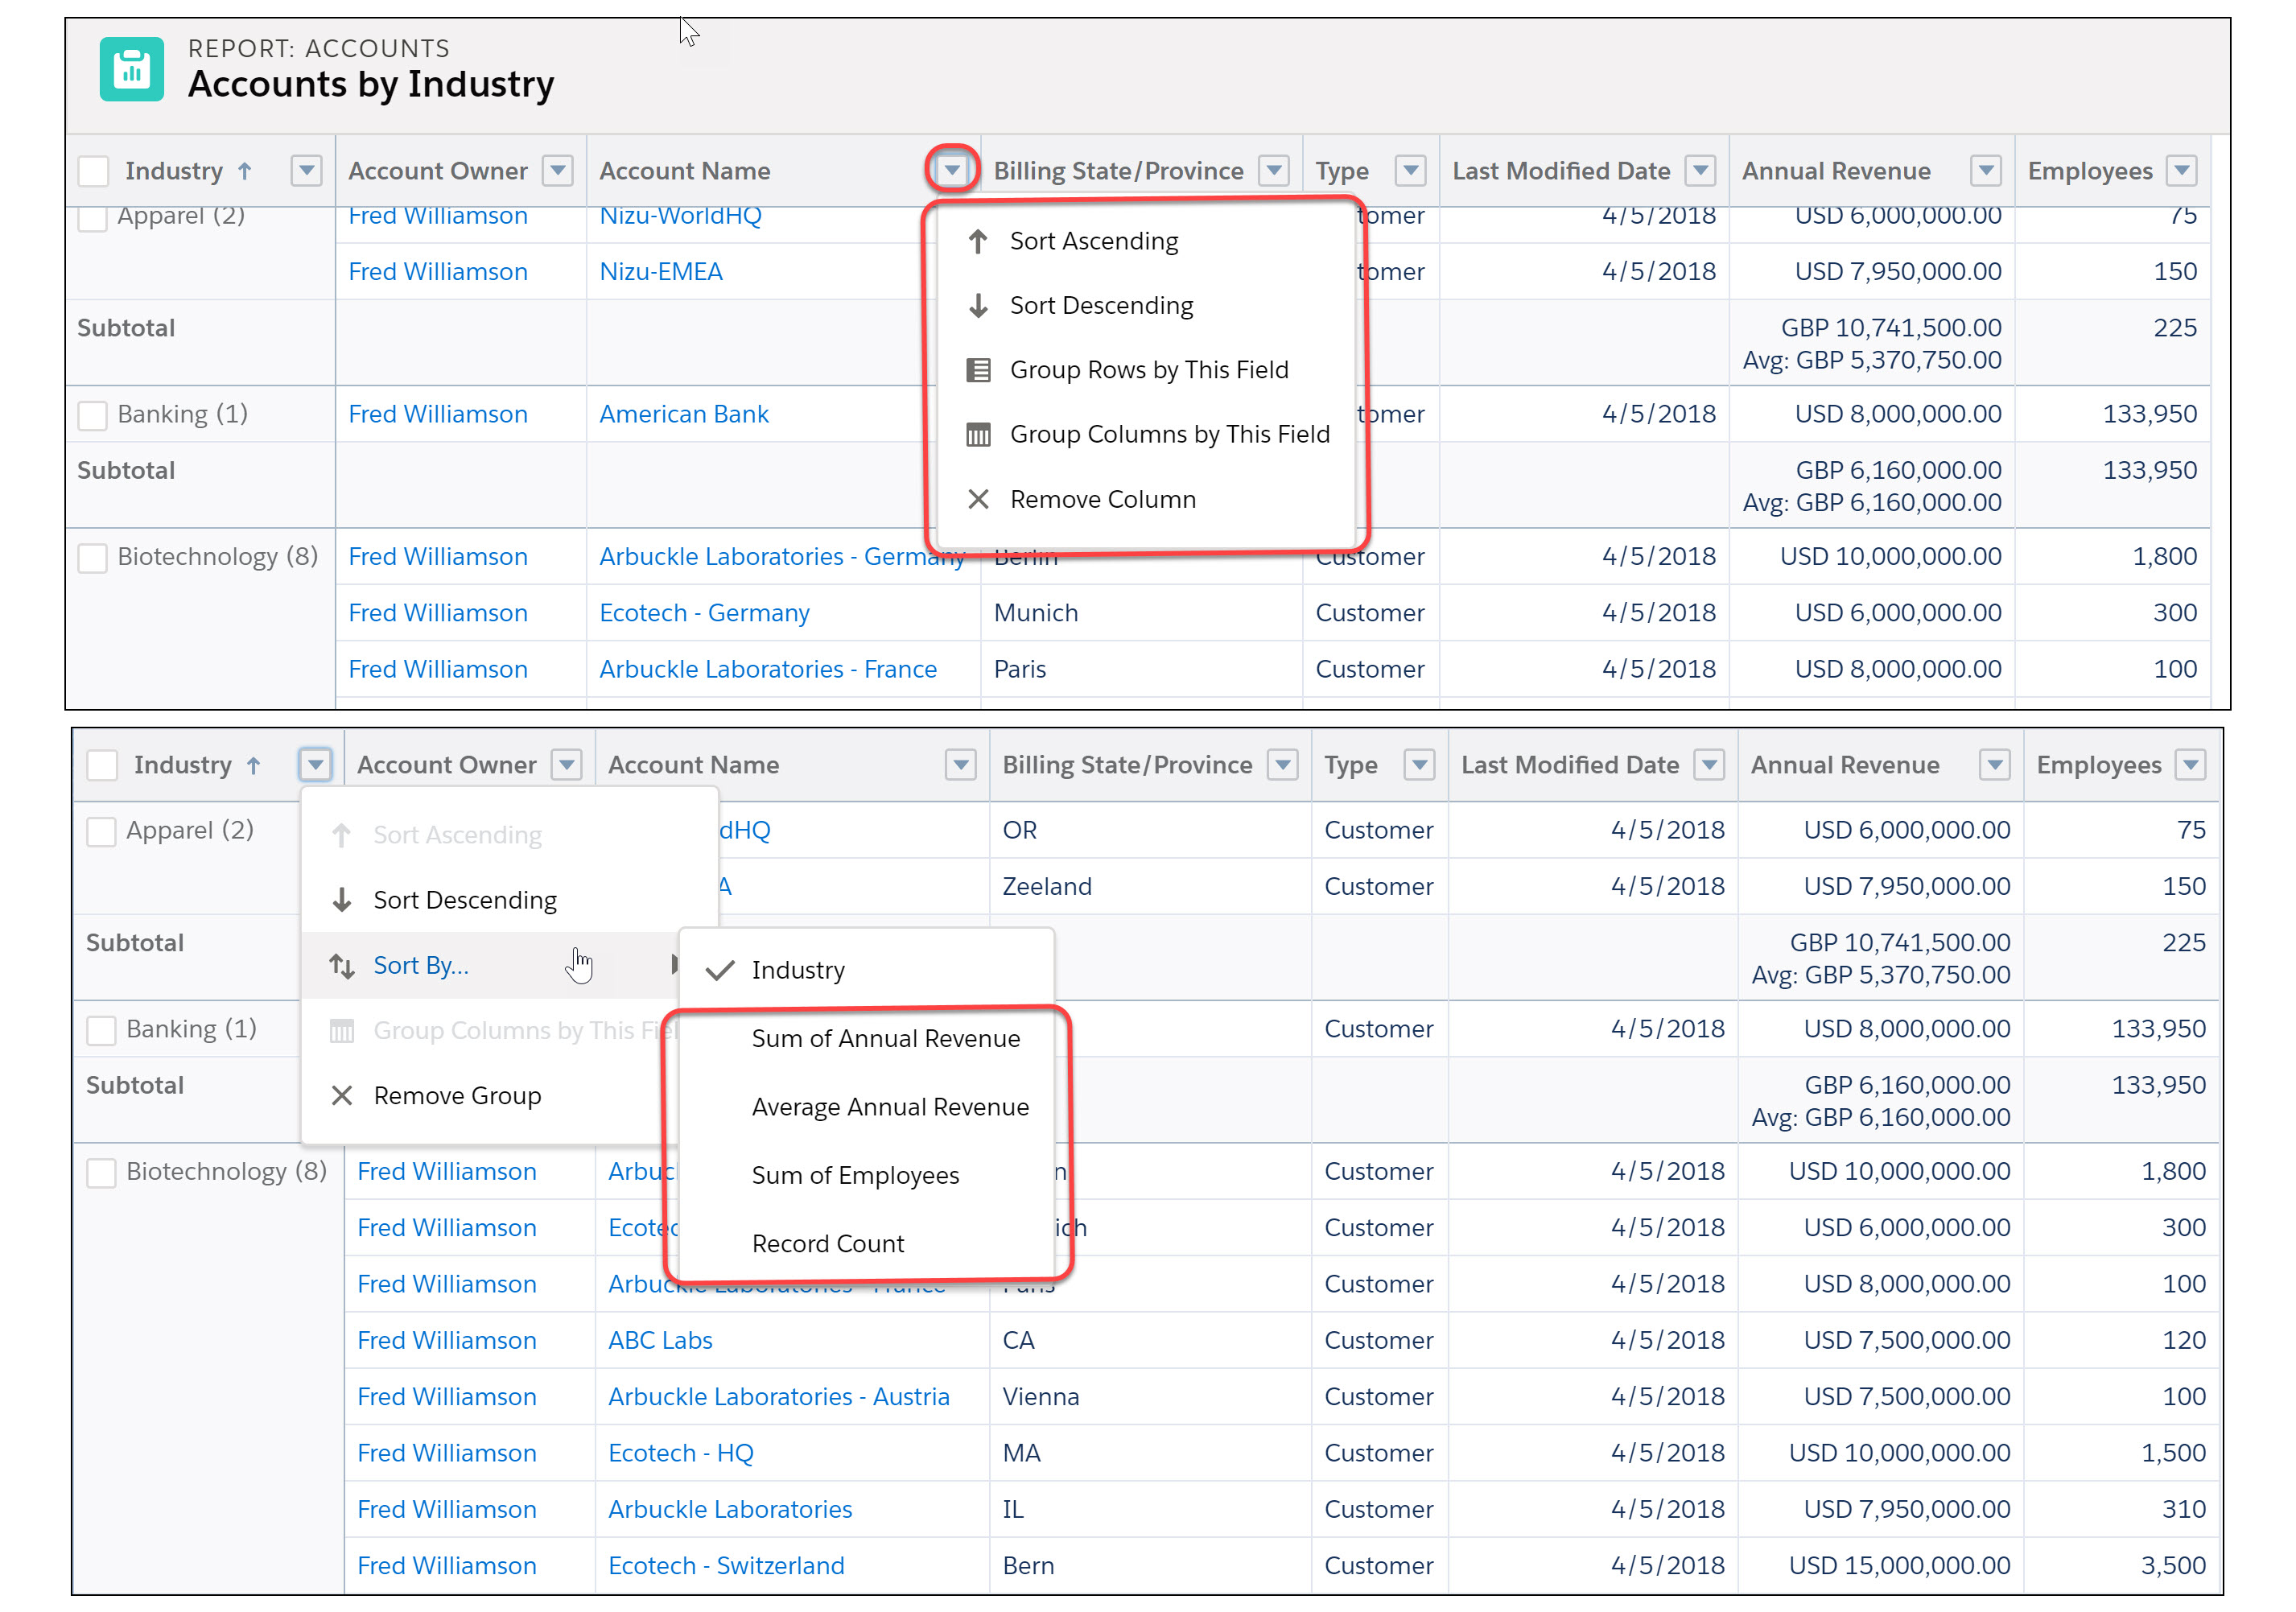
You can further customize how the records in the report display. From a column’s action menu, you can sort and group records, and even remove the column. You can also sort by various metrics from a grouping column.
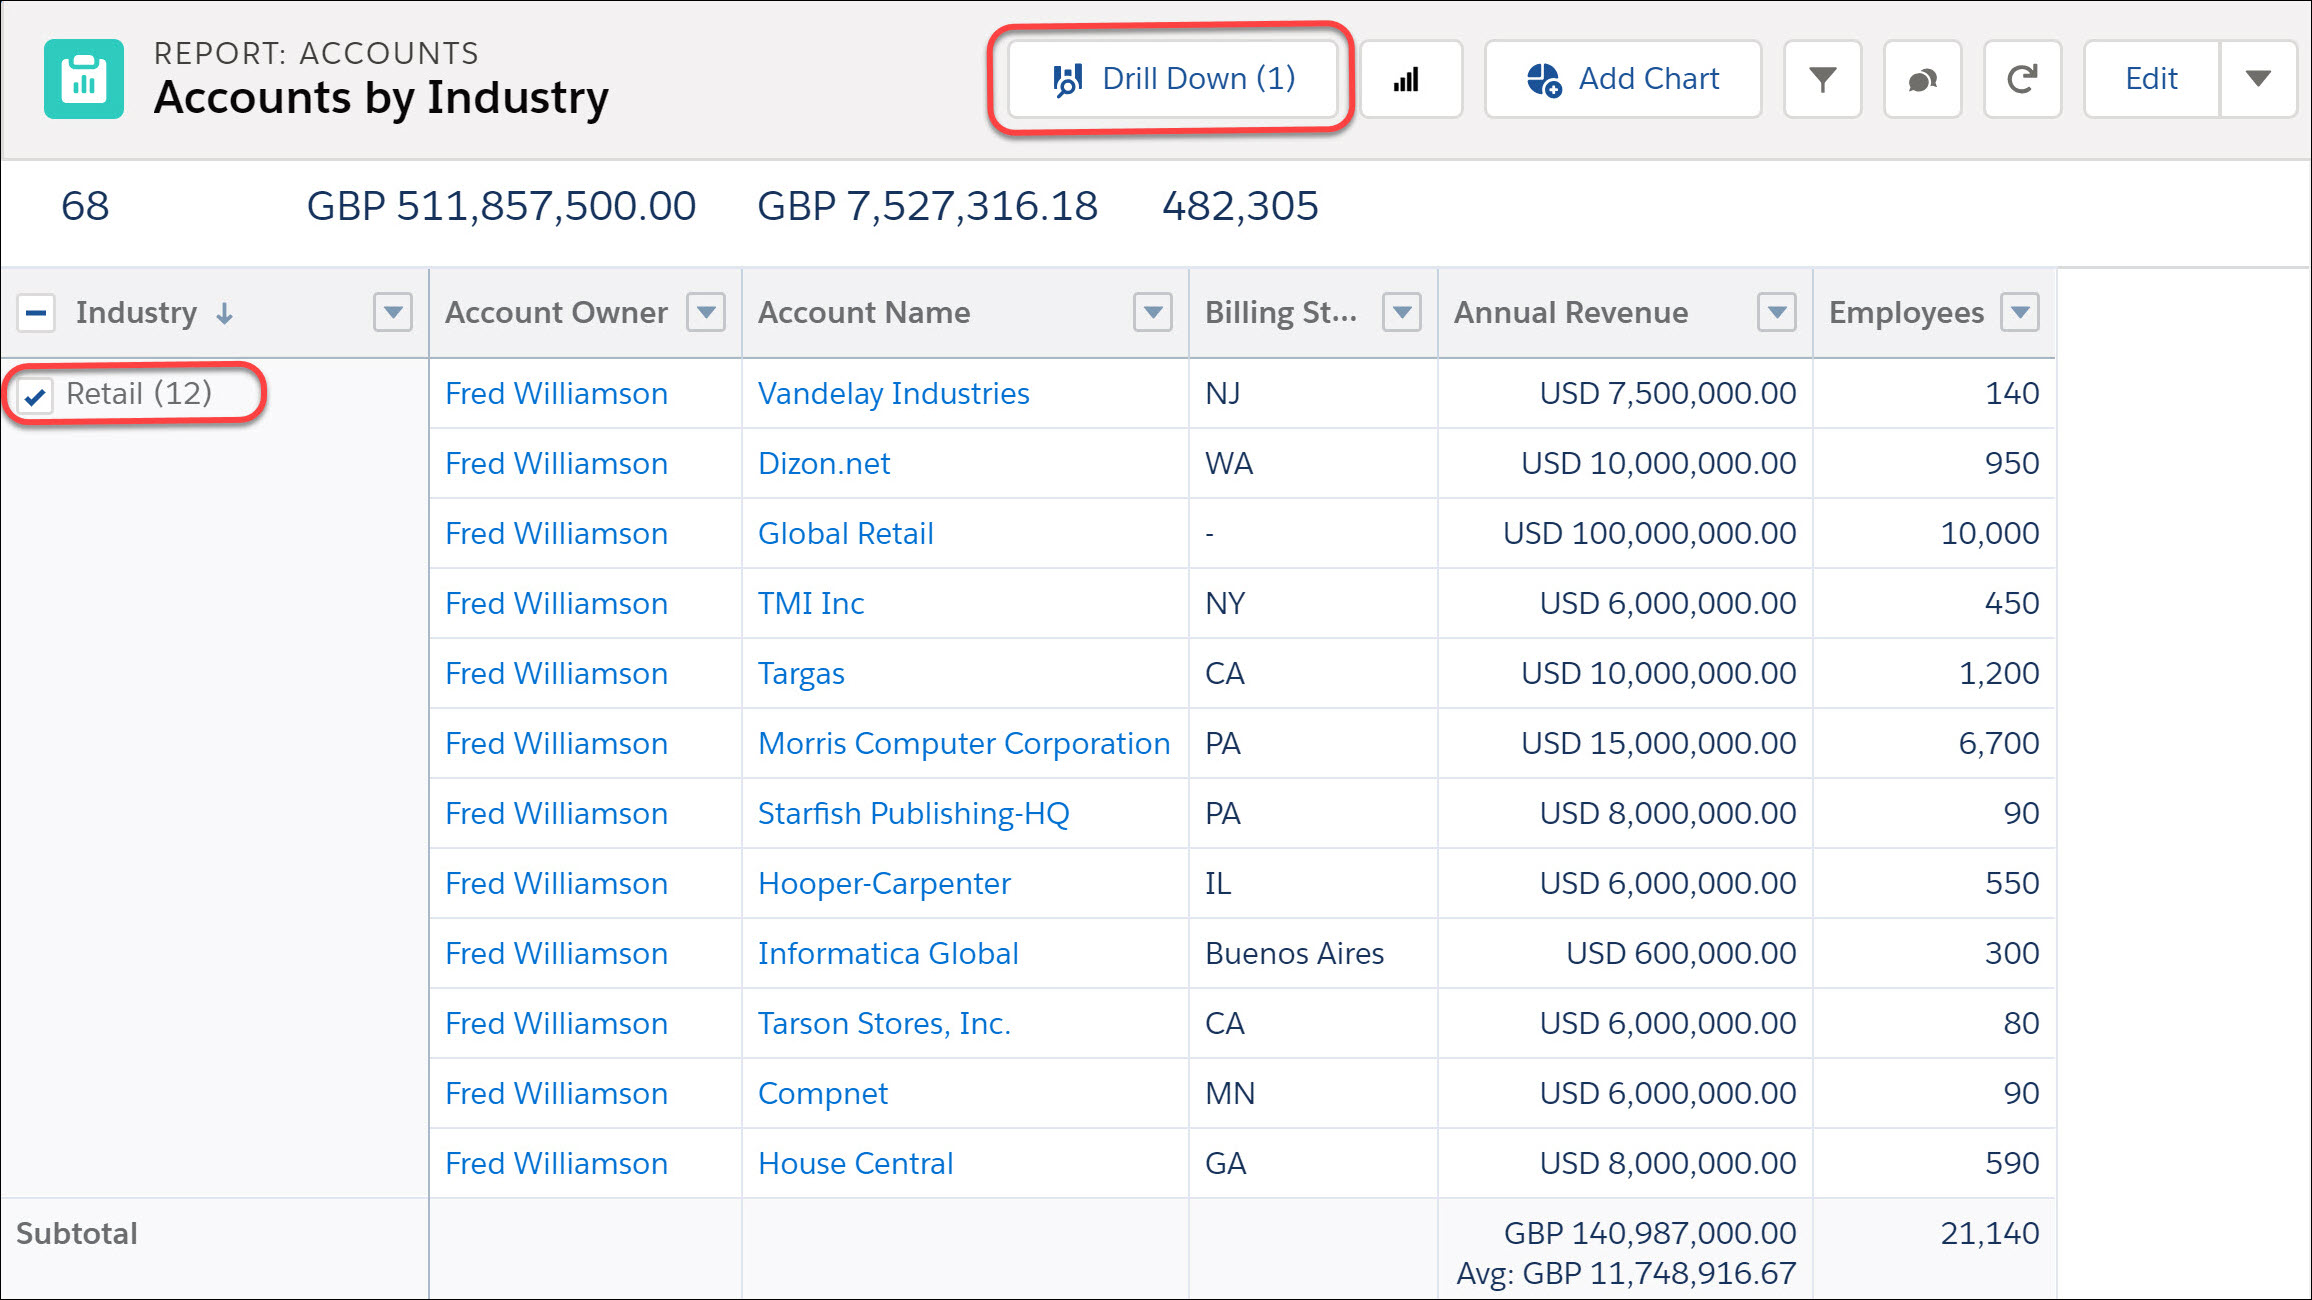
Want to take a closer look at records from a report that's grouped by rows (summary) or grouped by rows and columns (matrix)? On the report run page, select the box next to a primary grouping value you want to drill down. Click Drill Down. Specify the field you want to group the results by, and click Apply.
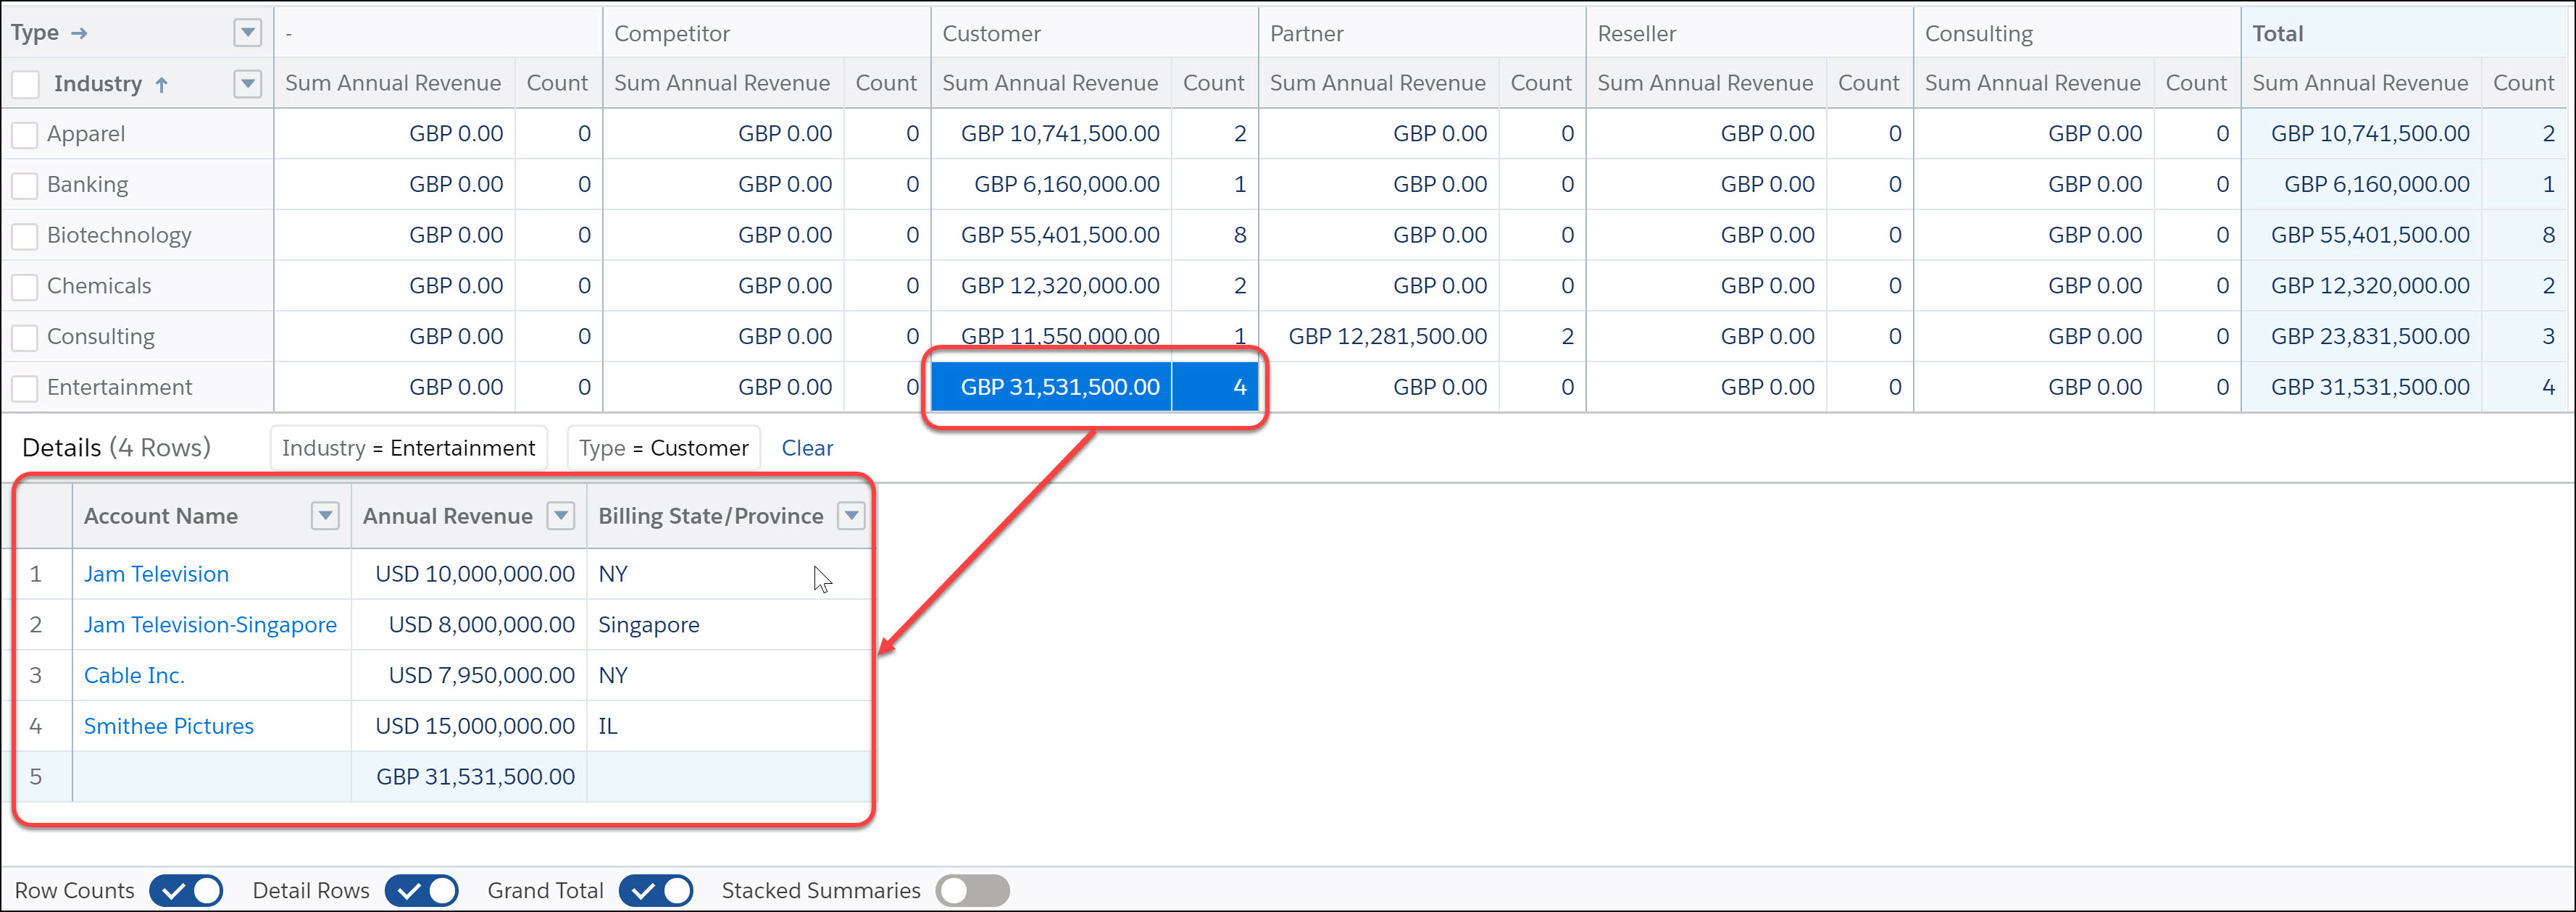
You can also view the record detail rows behind a report that's grouped by rows and columns (matrix). To do so, click the appropriate record in the summary table on the report run page. You can even click in the Total row.
Let’s say you’re looking at the Accounts grouped by Industry report in the run page. If you want to review the records for just a specific industry, click the count for that industry in the summary table.
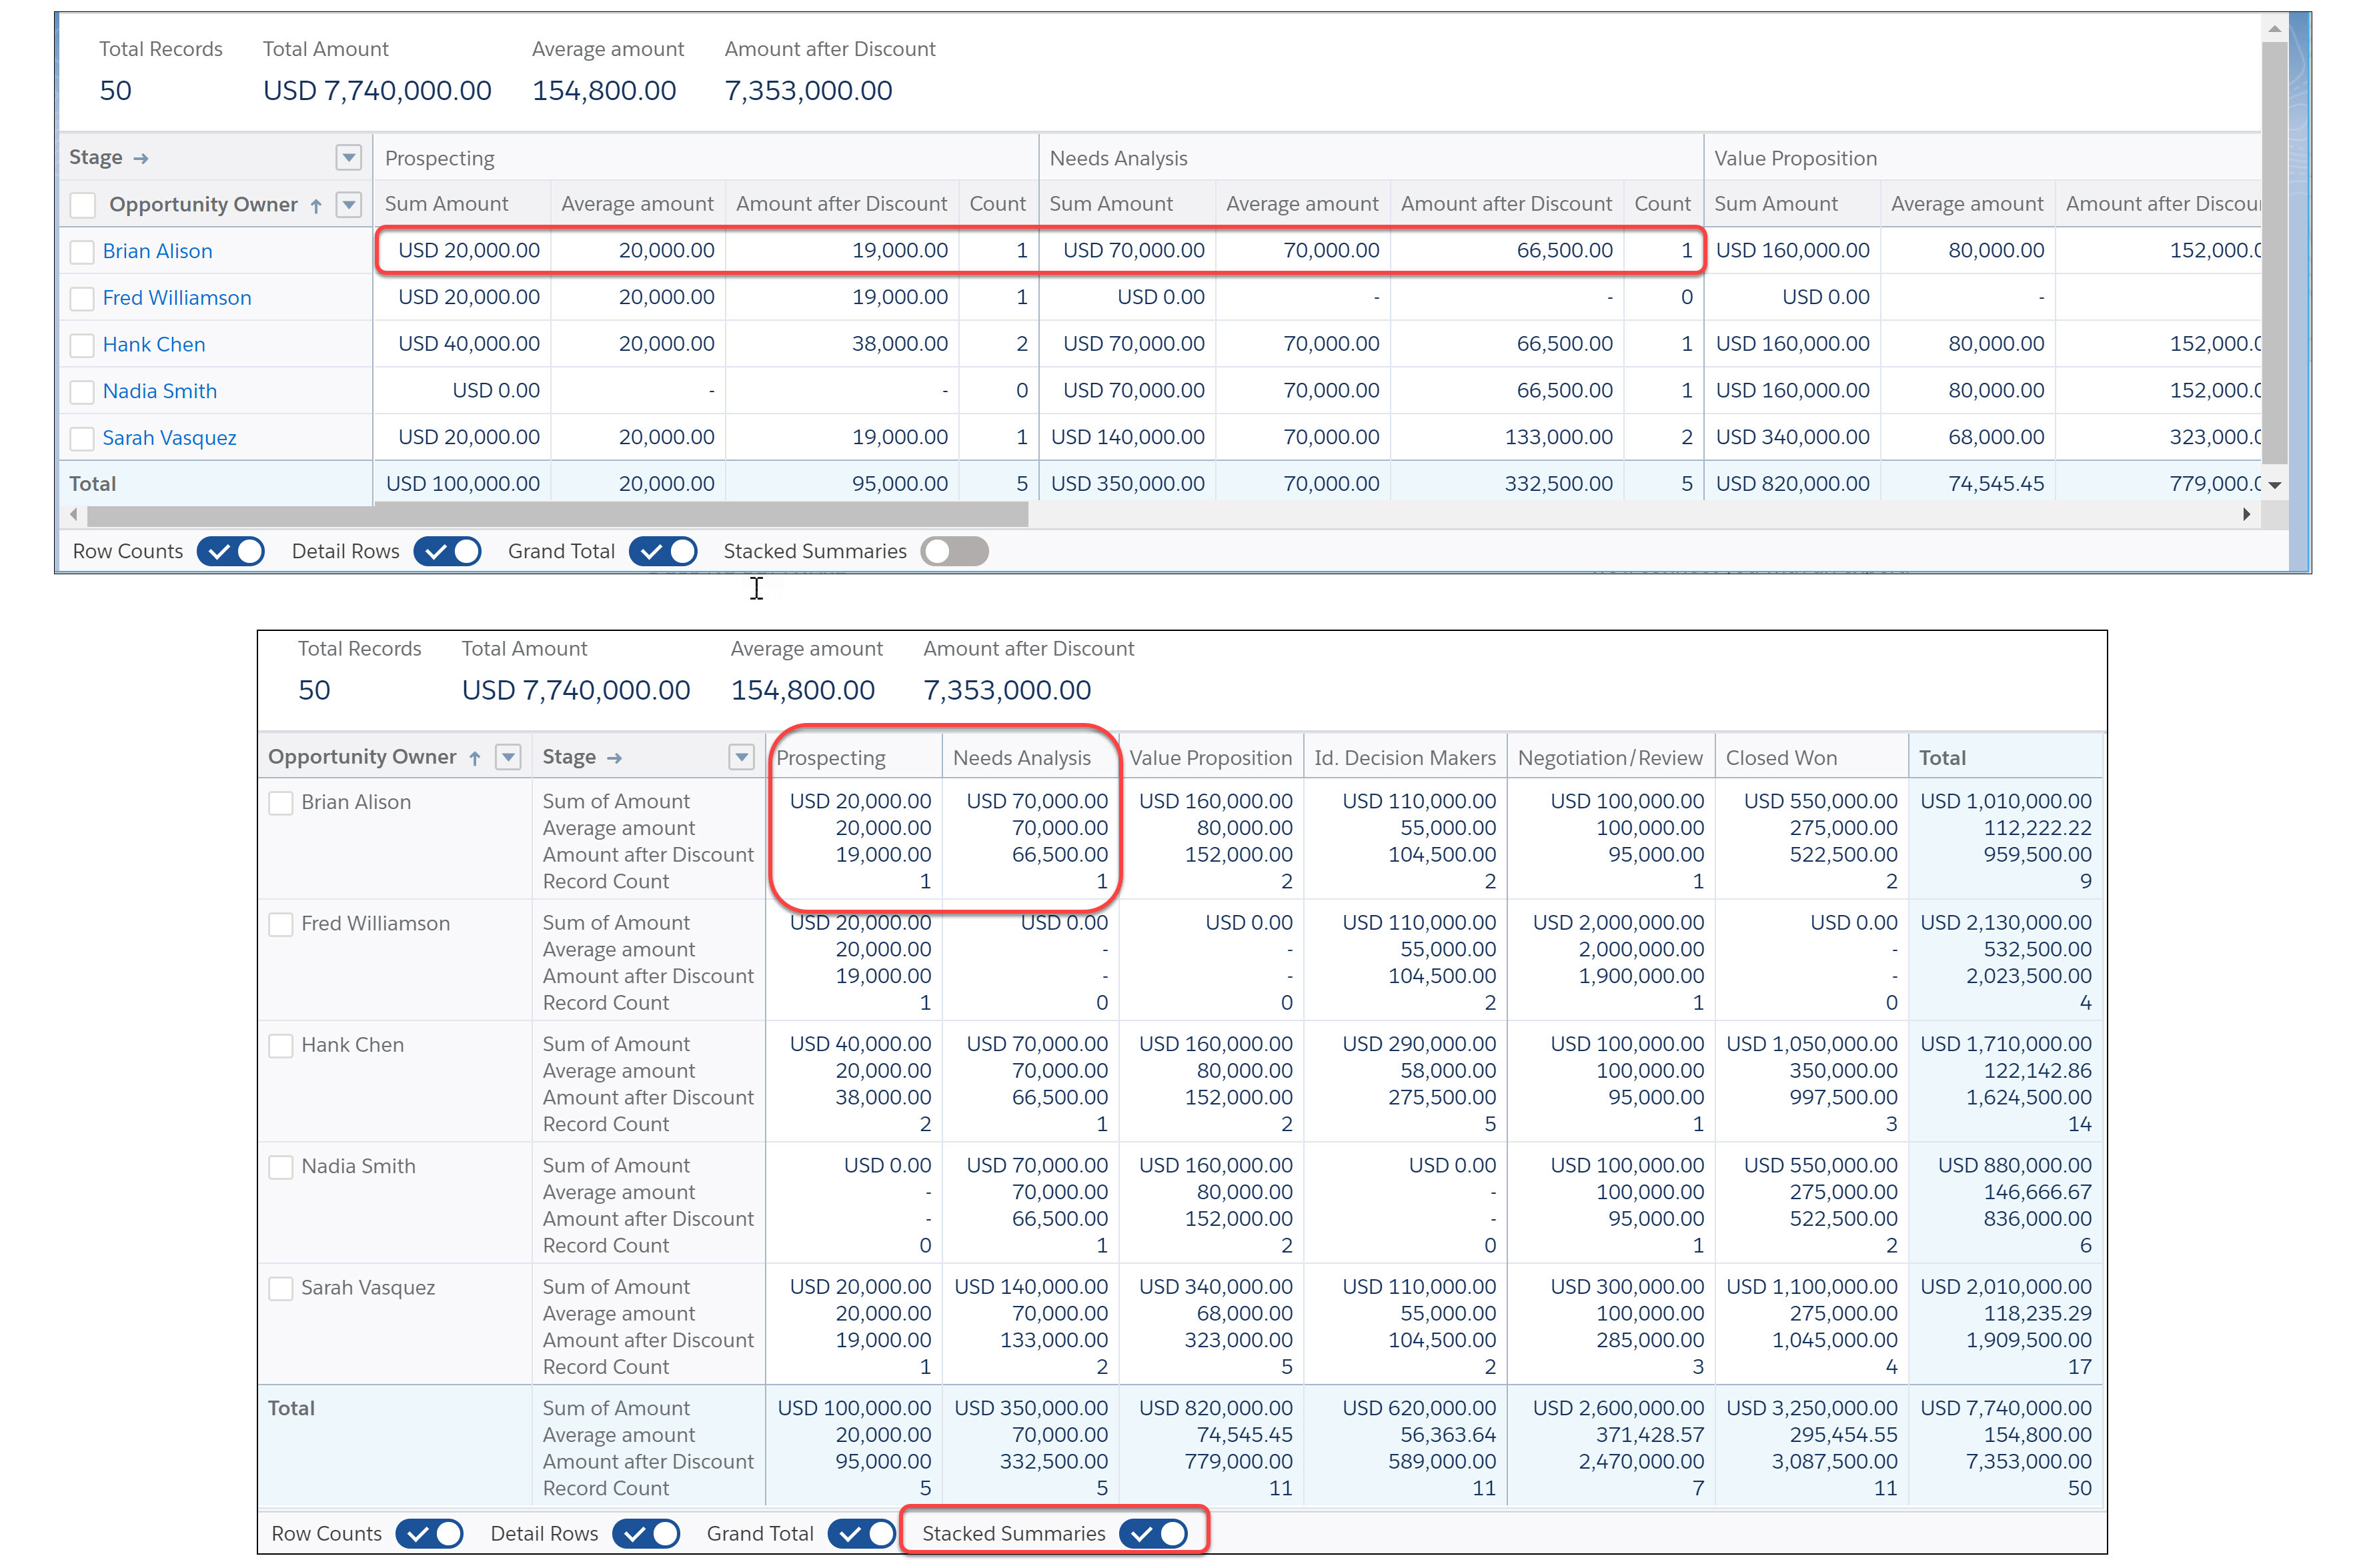
Want a more convenient view of summarized metrics in reports that are grouped by rows and columns (matrix)? For a viewer-friendly version of the report with less scrolling required, enable Stacked Summaries in the report footer.
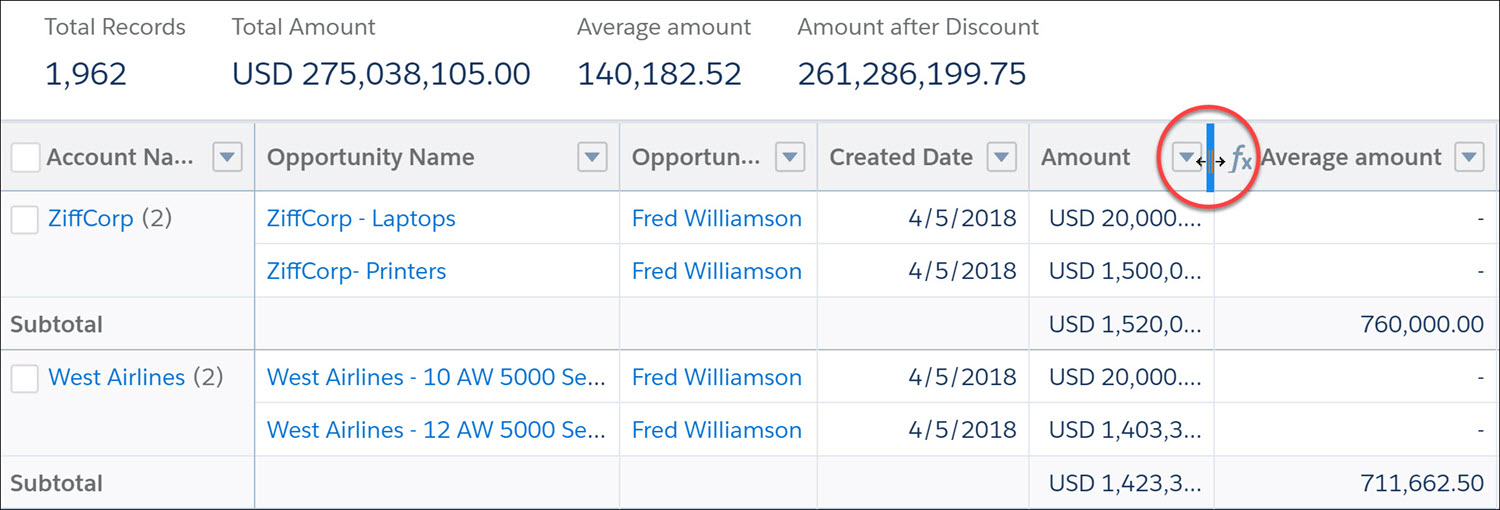
To resize a column width, hover over the column header’s right edge. When the resize cursor appears, drag the edge until the data fits right for you. When you’re done, click the cursor to set the new width.