You are here:
Filtering Report Charts to Show Data Relevant to the Page
Charts usually filter to show relevant data when the chart’s report type has a matching ID field for the record, such as Account ID for an account record. Occasionally, charts show data unfiltered. But you can set up a chart to be filterable if its report type has a lookup to the matching ID field.
Make a Chart Filterable
When the chart's report type doesn't have a matching ID field for the record, the chart isn’t filtered. Instead, it shows all data.
A report chart on open cases shows information for all accounts on an account record. To make the chart filterable, edit the layout of the chart’s cases custom report type, and add the Account ID field via lookup. Now when you view an account record, the chart is filtered.
Pick a Relevant Filter
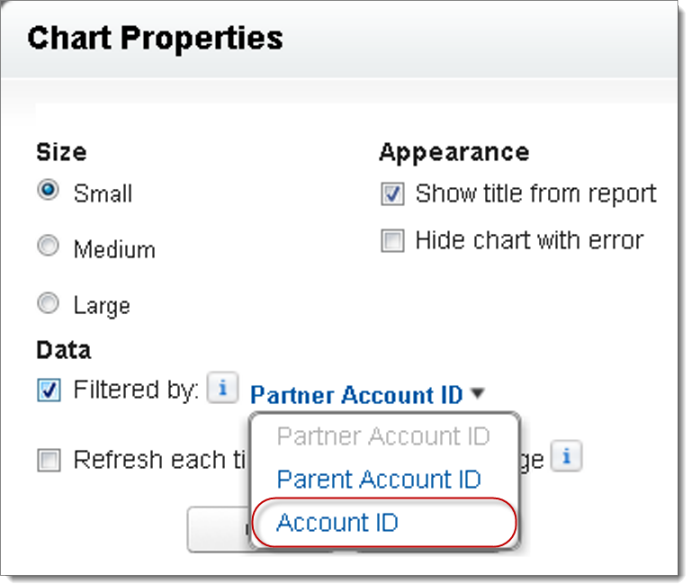
Sometimes when there are multiple ID fields available to filter, the chart doesn’t show any data. In such situations, select the most relevant ID field from the Filtered by dropdown in the Chart Properties dialog box. A chart on open opportunities on account records is filtered by Partner Account ID, which isn’t that useful. But we can edit the chart properties and choose Account ID from the dropdown to filter by the account record.