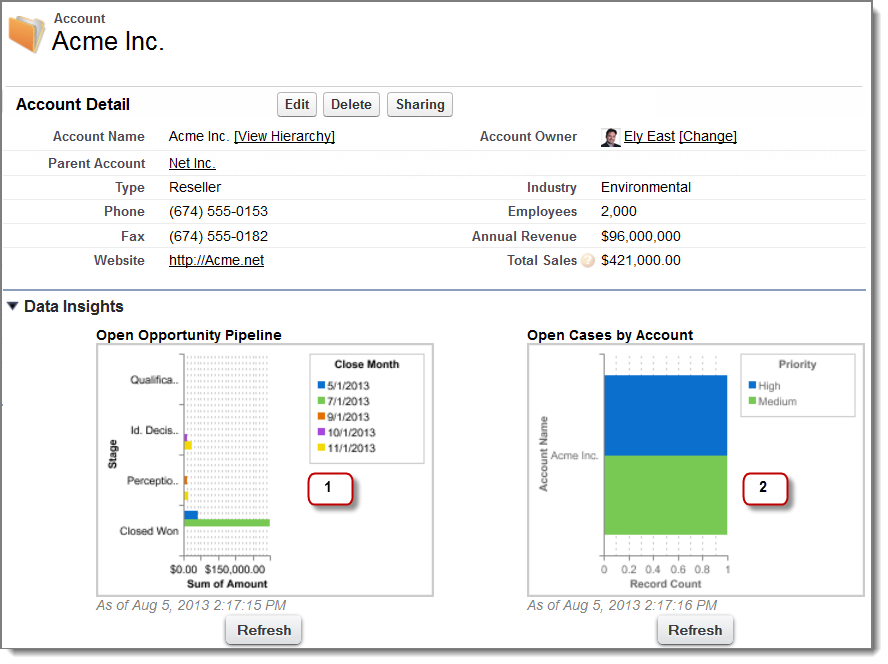
In this example, we've embedded two report charts on an
important account page that show deals in the pipeline and open support
cases for the account. From looking at the charts, the account executive
can quickly gauge the account’s activity and health.
Required Editions
Available in: Salesforce Classic and
Lightning Experience
Available in: Essentials, Group, Professional, Enterprise,
Performance, Unlimited, and Developer Editions
Available in: Enhanced Folder Sharing
User Permissions Needed
To create, edit, and delete reports:
Enhanced Folder Sharing
Create and Customize Reports
AND
Report Builder
Report Charts on an Account Page
The pipeline chart shows opportunities for the account in various stages including two that were
won. The account executive can hover on the chart to get the value of each opportunity (Values
are highlighted if the source report chart has hover enabled). She’s able to click the chart,
go to the report, and get more details for these opportunities.
From the charts on open cases, she can see there are a couple
of unresolved support issues for the account. She can click the chart,
drill into the report for case details and follow up with the support
engineers to get them resolved before a crucial meeting with the client.
Did this article solve your issue?
Let us know so we can improve!
Loading
Salesforce Help | Article
Cookie Consent Manager
General Information
Required Cookies
Functional Cookies
Advertising Cookies
General Information
We use three kinds of cookies on our websites: required, functional, and advertising. You can choose whether functional and advertising cookies apply. Click on the different cookie categories to find out more about each category and to change the default settings.
Privacy Statement
Required Cookies
Always Active
Required cookies are necessary for basic website functionality. Some examples include: session cookies needed to transmit the website, authentication cookies, and security cookies.
Functional Cookies
Functional cookies enhance functions, performance, and services on the website. Some examples include: cookies used to analyze site traffic, cookies used for market research, and cookies used to display advertising that is not directed to a particular individual.
Advertising Cookies
Advertising cookies track activity across websites in order to understand a viewer’s interests, and direct them specific marketing. Some examples include: cookies used for remarketing, or interest-based advertising.