You are here:
Examples of Using the Log Inspector
Here are some of the ways you can use the Log Inspector to diagnose and solve problems.
Tracing the Path of Execution
Scenario: You’ve opened a debug log in the Log Viewer. What are some of the ways to step through the information?
- In the Execution Log panel, select Executable to filter out all non-executable steps, including cumulative limits information.
- In the Execution Overview panel, click the Executed Units tab to view the aggregate values of different types of operations in the request. For example, you can view the number of DML operations or the different methods by the type of method.
- Click the Limits tab to view the governor limits used by this operation.
Viewing System.Debug Statements
Scenario: You’ve added a number of System.Debug statements to your code to track a request's progress.
How do you find them using the Log Viewer?
- In the Execution Log panel, select Filter.
- Enter DEBUG (upper-case) in the entry box.
Only the lines containing the string DEBUG are shown in your request display.
Updating the Source Code
Scenario: After you run your request, you notice an Apex code error in the debug log. What's the easiest way to edit your Apex code?
- From the Source panel, select the line of code.
- Click Open.
The class or trigger opens in a new Log Viewer tab.
Tracking DML in a Request
Scenario: Your request contains many DML statements in different locations. How can you tell how many times DML is executed in a request?
Here are two techniques for drilling into a debug log to examine the actual DML executed during the course of a request:
- In the Execution Log panel, select Filter, then type DML. All items in the request that contain DML anywhere in either the event or details display.
- In the Execution Overview panel, click the Executed Units tab and disable all
other types of execution, except for DML. The buttons are toggles—click once to
filter that type of operation out of the list. Click
again to disable the filter. To view only the DML, click
Methods, Queries,
Workflow, Callouts,
Validations, Triggers and
Visualforce Pages.
- The details of the DML operation show the kind of object that was affected, and the specific operation performed—insert, update, and so on. You can also view the number of times a DML statement was executed, the number of rows, and so on.
- If you click a DML request item in the Executed Units tab, the Execution Log filters out all other parts of the request and displays only that DML statement.
You can also use these procedures for looking up and filtering queries.
Evaluating the Performance of a Visualforce Page
Scenario: You have a Visualforce page and an Apex controller that executes SOQL queries. How do you analyze the performance of your page and find out which code unit took the most time? How do you determine how many queries are performed in the request? How do you verify how close you are getting to governor limits?
- In the Stack Tree panel, look for the name of the Visualforce page. The top level has the format /apex/pagename. The first node under that shows the actual execution of the page. Open that node to see when the controller was initialized.
- Continue to open nodes to explore the calling of methods and how long each method took. When you click an item in the Stack Tree panel, the Execution Log panel displays that portion of the debug log, the Source panel refreshes to display the appropriate source code, and the Variables panel shows the variables that are in context.
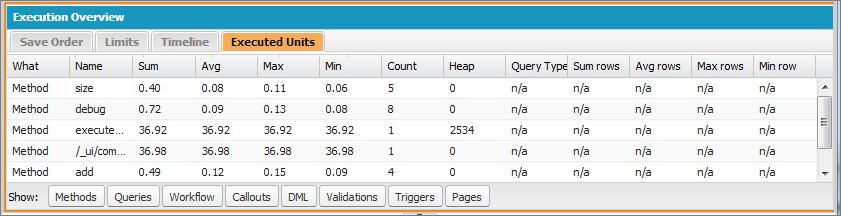
- In the Execution Overview panel, click the Executed Units tab to view statistics
of your code that include execution time in milliseconds and heap size in bytes.
The Cnt column shows the number of times a certain code unit has been executed.
If a code unit was executed more than once, the sum, average, maximum, and
minimum run times are updated. Similarly, if a query is executed more than once,
the display is updated to summarize the aggregate numbers of returned rows.
You can filter out code units by clicking the buttons on the bottom that correspond to the code units you want to omit from the view.
- Click the Limits tab to verify the applicable limits, and how close your request is to each applicable limit. The Total Available column shows the governor limits allowed for your organization per type of operation. The Request Total column shows the total number of requests performed. The Used So Far column shows the number of requests consumed at the point of execution you selected in the stack trace or execution log.
- Click the Timeline tab to see a visual display of the executed code units broken
up by the type of code unit, in addition to the total and percentage of
execution time for each type of code unit. The timeline lets you quickly find
out which parts of the request took the longest. Select a time interval at the
bottom of the summary section to increase or decrease the period displayed in
the timeline.
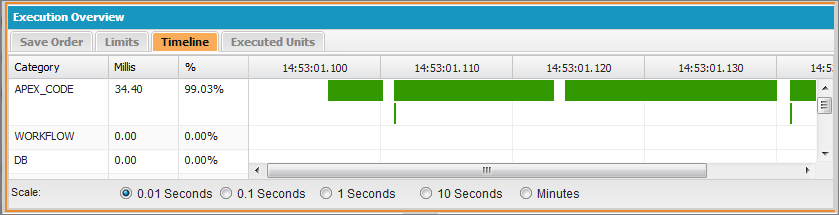
In this example, database requests took the most time (56.95%). They are followed by the Visualforce page. The least amount of time was spent on Apex code. Also, Visualforce pages and Apex code were executed first and last, while database operations were carried out between them.
Viewing a Complex Process
Scenario: Your process is complex, and includes several Apex classes and triggers, workflow, and validation rules. What are some of the best ways to step through or filter the resulting debug log?
- The Stack section contains a tree structure illustrating the execution path of all the top level items in the request. Use this to see the hierarchy of items as they execute.
- Use the Filter entry box in the execution log. For example, if you’re interested in trigger-specific events, click Filter and enter trigger. Only the lines in the debug log that contain the word trigger display in the execution log section.
- Limit the scope of the Execution Log tab to a specific selected unit of
execution by selecting This Frame. For example, if you
select a line that contains
CODE_UNIT_STARTEDin the execution log, and then click This Frame, the execution log displays only the items in the request that occur betweenCODE_UNIT_STARTEDand its associatedCODE_UNIT_ENDED.

