
You are here:
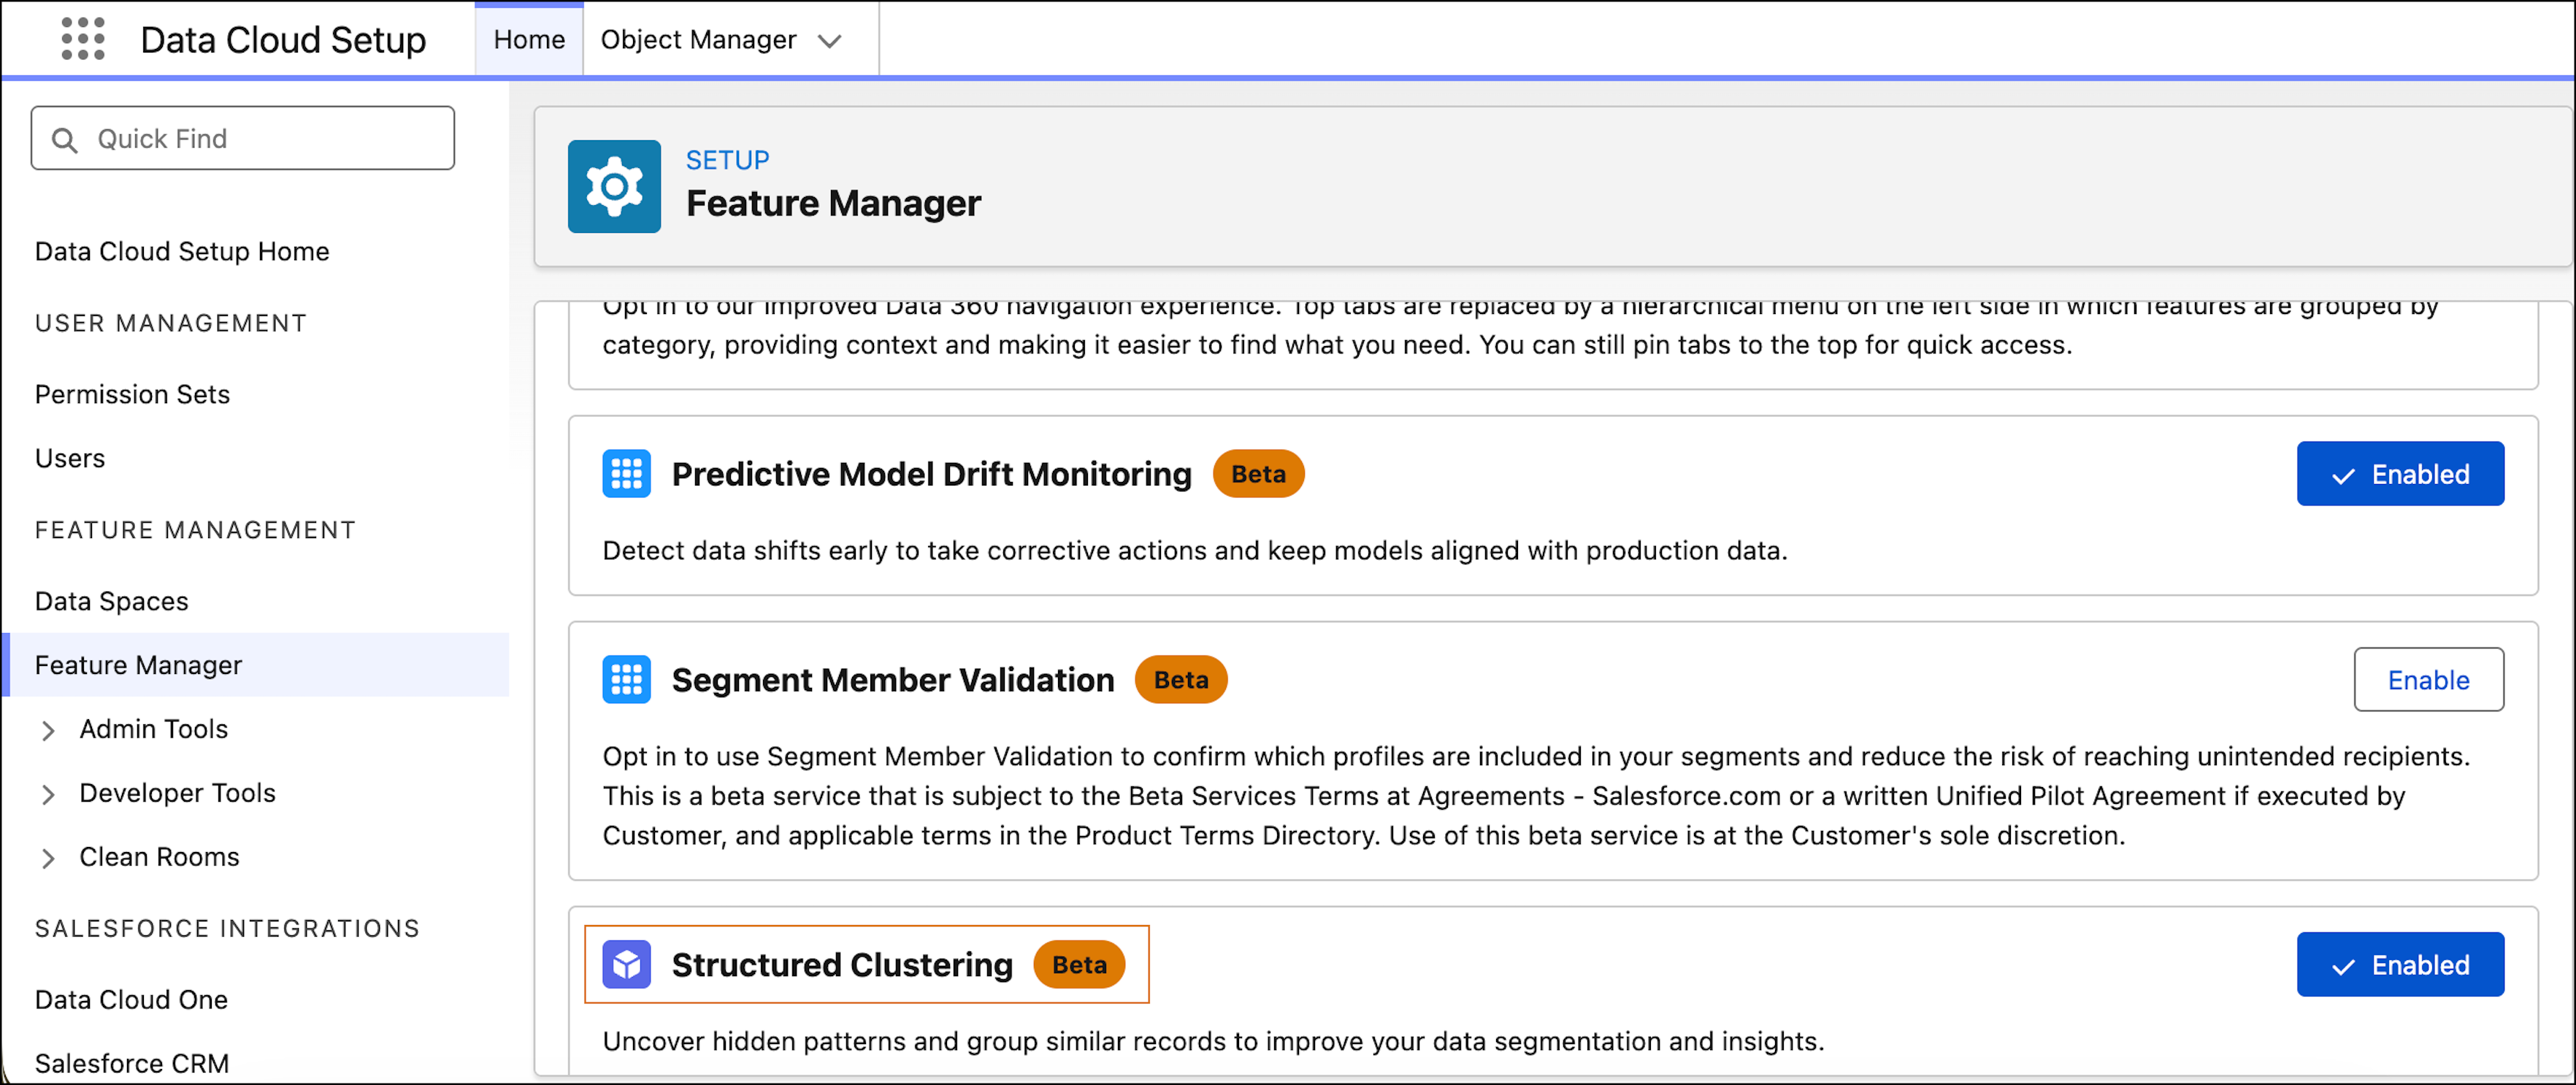
Structured Clustering (Beta)
Use clustering in Data 360 to uncover hidden patterns and discover natural groupings in structured data based on similarities in the fields that you select. Clustering identifies emerging customer profiles, recurring support patterns, and unexpected behavioral trends.
After training, the model assigns each record to a cluster ID and a system-generated cluster label. For example, a model trained on purchase data identifies groups such as "Loyal Customers," "Big Spenders," or "At-Risk Customers" automatically. The trained model maps new records consistently to existing clusters over time. It evaluates incoming data and assigns a similarity score that indicates how closely each record matches its cluster. Data 360 adds these output fields to your dataset. Apply the output fields to drive segmentation, analytics, and activation across Salesforce.
Review these clustering goals.
-
Segment customers or records into meaningful groups automatically
-
Discover patterns and similarities across data attributes
-
Identify high-value, at-risk, or behavior-based segments
-
Enrich datasets with cluster IDs and labels for targeting, personalization, and analysis
Clustering Settings
To use clustering, turn on the Structured Clustering (Beta) from Feature Manager in Data Cloud Setup.
Clustering Capabilities
The K-means algorithm groups records into a defined number of clusters based on similarity. The model defaults to 3 clusters, but you can define this setting manually. To cluster noisy or real-world data and group outliers into a separate catch-all cluster, use the HDBScan algorithm.
Review these clustering capabilities.
- Model building and training with structured data model objects (DMOs) in the AI Models tab
- Cluster quality evaluation with training metrics, such as cohesiveness score, distinctness score, and silhouette score
- Cluster summaries and representative sample records that show which field values characterize each cluster
- Custom cluster labels assigned to override system-generated labels
- Clustering inference on new data via flows to assign records to existing clusters
- Inference outputs, such as cluster ID, cluster label, similarity score, and top factors
Cluster Quality Metrics
To assess whether your clusters are meaningful, review these metrics after model training.
| METRIC | whAT IT MeASURES |
|---|---|
| Cohesiveness Score | How similar records within a cluster are to each other. Higher is better. |
| Distinctness Score | How different clusters are from each other. Lower values indicate more distinct clusters. |
| Silhouette Score | Combined measure of cohesion and separation, ranging from -1 to 1. Scores above 0.7 indicate well-defined clusters. |
If scores are low, remove variables that create noise, adjust the number of clusters, or retrain the model.
When you run a flow on new data during inference, each record receives these outputs.
- A cluster ID
- A cluster label
- A similarity score
You can assign these outputs to records, use existing flow components or the ingestion API.
Considerations
Review these considerations.
- Results vary depending on the fields and parameters used.
- Very small or highly similar datasets produce less distinct clusters.
- Relevant and high-quality input fields provide better clustering results.
- Periodic retraining keeps clusters aligned with changing data.