
You are here:
Aggregate Node: Roll Up Data to a Higher Level
Use an Aggregate node to roll up data to a higher granularity. You can aggregate using: unique, sum, average, count, maximum, and minimum. You can group by any dimension or date column. You can also pivot dimensions as columns. For example, you can group opportunities by account to get account-level details, like total opportunity amount, average number of cases, and the average days to close an opportunity for each account. You can then pivot on account type to analyze each combination of account and account type.
- In a batch data transform that already has at least one Input node, select the Add Node
button (
 )
between two nodes or at the end of the data transform. To show the Add Node button between two
nodes, hover the cursor on the connecting line.
)
between two nodes or at the end of the data transform. To show the Add Node button between two
nodes, hover the cursor on the connecting line. - In the Add Node dialog box, select Aggregate.
- Add at least one aggregate.Before you can add a grouping, add an aggregate. You can select one of the following aggregate functions.
To apply an aggregate function to currency values, set a currency. If you don't specify a currency, the node uses the currency from the first row of data.
Aggregate Function Description Unique Counts only unique values in the selected column. Sum Calculates the total by adding all values in the selected column. Average Calculates the average value of the selected column. Count Counts all values in the selected column. Maximum Calculates the maximum value of the selected column. Minimum Calculates the minimum value of the selected column. Stddevp Calculates the population standard deviation. Population standard deviation measures the spread of data distribution—the typical distance between each data point and the average. Stddev Calculates the sample standard deviation. Sample standard deviation measures the spread of data distribution for a given sample. Use sample standard deviation to estimate the population standard deviation based on a sample. Varp Calculates the population variance. Population variance indicates how spread out data points are in a specific population. Var Calculates the sample variance. Sample variance indicates how spread out data points are for a given sample. Use sample variance to estimate the population variance based on a sample. 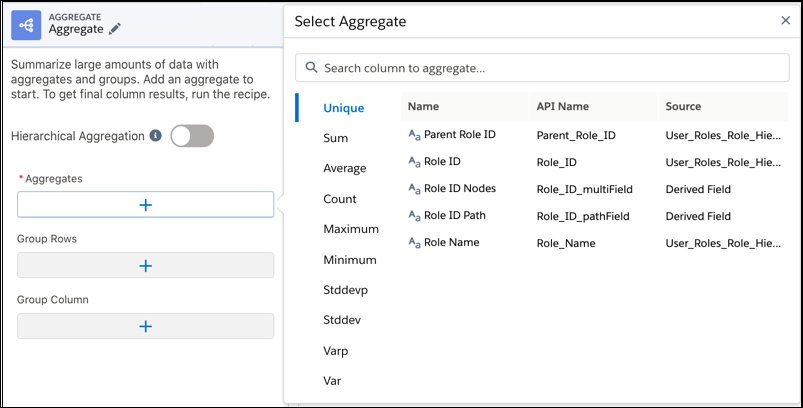
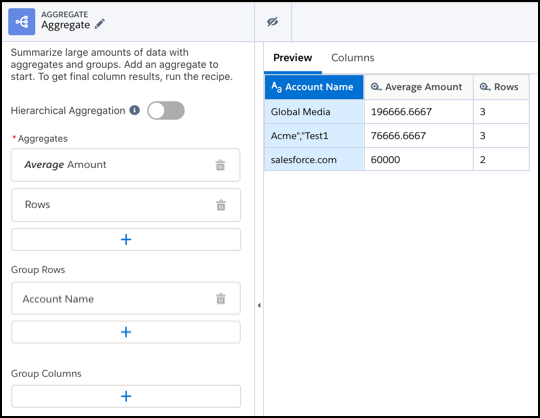
- To group rows, add one or more dimension or date columns in the Group Rows column.
For example, you can group by account name.
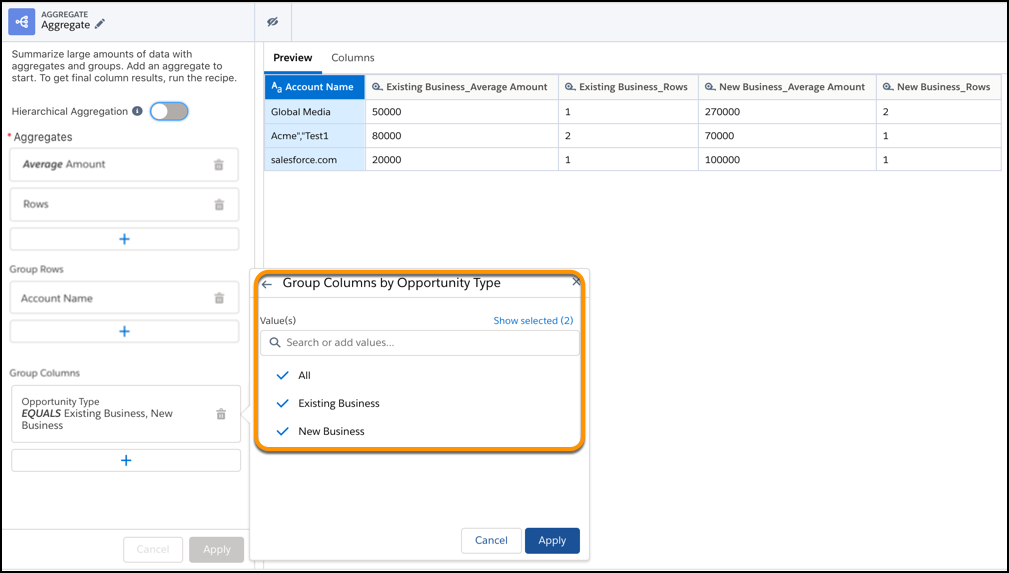
- To pivot dimensions as columns, add up to two dimension columns in Group Columns, select
the values for each dimension column and click Apply. You can search all
values in the input data source object. If a value doesn’t appear in the list, adjust your
sample size or refine your search. Then, click Add new value and enter
the value.
For example, you can group columns by opportunity type. Each combination of opportunity type and aggregate appears as a separate column.
- To add the Aggregate node to the data transform, click Apply.
- Save the batch data transform.