
Summary Rollup Metrics in Flexible Hierarchies
Understand how summary rollup metrics aggregate data across nodes in a flexible hierarchy so that your business users can make faster, data-backed decisions during live business reviews.
Required Editions
Available in: Lightning Experience Available in: Unlimited and Agentforce Editions |
Summary rollup metrics help business users visualize aggregated financial or business data across all levels of a flexible hierarchy. By configuring these metrics in a hierarchy type, you can show aggregate values, such as total opportunities or account balances, at every node. This gives your teams a clear picture of performance from individual contributors up to the top of the organization.
How Summary Rollup Metrics Work
To plan and implement summary rollup metrics correctly, learn how their setup, configuration, and computation work together. Set up the four interconnected elements of summary rollup metrics in the correct order to prevent configuration errors and ensure that values appear correctly on hierarchy nodes.
| Element Type | Purpose | Setup Location |
|---|---|---|
| Node Measure Type picklist value | Defines the business category to summarize, such as total opportunities or total account balance | Object Manager — Flexible Hierarchy Node Summary — Node Measure Type field |
| Summary Rollup Metric | Binds the node measure type to a hierarchy type to help end users view rollup values on nodes | Flexible Hierarchy Setup — Hierarchy type — Summary Rollup Metrics section |
| Data Processing Engine (DPE) definition | Computes node, child aggregate, and total values, and writes the results to Flexible Hierarchy Node Summary records using the same node measure type | Data Processing Engine Setup |
| Schedule-triggered flow | Runs the Data Processing Engine definition on a schedule to keep rollup values current | Flow Builder |
Flexible hierarchy node summary records store rollup metrics. Each node summary record captures three distinct aggregate values for a given node measure type.
- Node Value: The node directly contributes the individual value. For example, the total opportunity amount associated with a single account node.
- Child Aggregate Value: The combined value of all child nodes, excluding the node's own direct contribution. For example, the total opportunity amount across all child accounts, not counting the parent account itself.
- Total Value: The consolidated total for the node, combining the node's direct value with all child node contributions. For example, the total opportunity amount for a region, including all accounts under it and the region node itself.
The Role of the Data Processing Engine
Summary rollup metrics require Data Processing Engine definitions to calculate values and write the results in flexible hierarchy node summary records. Schedule these definitions to run regularly to keep the hierarchy view up to date. You can create Data Processing Engine definitions either by using Data Cloud Runtime or CRM Analytics Runtime.
Depending on transform complexity, configure multiple key performance indicators (KPIs) in a single Data Processing Engine definition by grouping multiple fields and by using formulas to identify measure types. Alternatively, create individual Data Processing Engine definitions for each metric.
Summary Rollup Metrics in Context
Cumulus Corporation is a sales organization that tracks total opportunity amounts across a regional hierarchy. Here's the hierarchy diagram that shows how summary rollup metric values flow through the hierarchy. The hierarchy includes a corporate parent node and child nodes for the North and South regions.
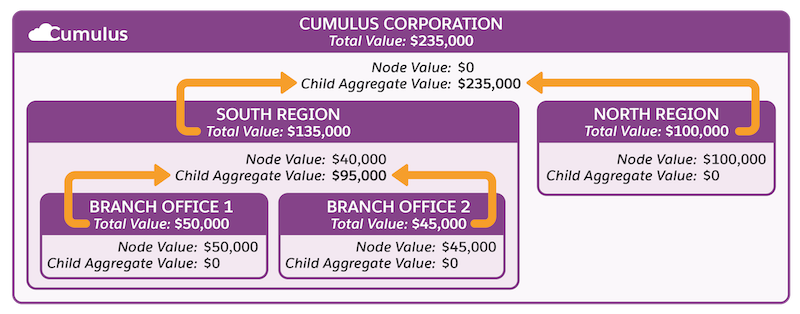
- Parent Node (Cumulus Corporation): The corporate headquarters has no direct opportunities (node value). The South and North regions contribute $235,000 (child aggregate value), bringing the total opportunity pipeline to $235,000.
- South Region (Child Node 1): This region has $40,000 in direct opportunities (node value). Its branch offices contribute an additional $95,000 (child aggregate value), bringing the total value to $135,000.
- North Region (Child Node 2): This region has $100,000 in direct opportunities (node value). The total value remains $100,000, because it has no child nodes (child aggregate value: $0).
- Grandchild Nodes (Branch Offices): Branch Office 1 and Branch Office 2 have $50,000 and $45,000 in direct opportunities (node value), respectively. Their combined $95,000 rolls up into the South Region's child aggregate value.
The summary rollup for the Cumulus Corportation provides a complete, top-down view of total performance across the organization. Users can drill down at any level to instantly separate a node's direct contributions from its aggregate totals.
Use Cases
Here are a few use cases for summary rollup metrics in a hierarchy context.
- Provides a real-time, consolidated view of business data across regions, business units, or account structures without building separate reports for each node.
- Identifies performance trends and gaps at any point in the hierarchy, enabling faster, data-driven decisions across the organization.
