
You are here:
Use the My Book of Business Dashboard (Managed Package)
Financial advisers: Start with an overview of your financial book of business and how it has changed over time. Get alerts about changes compared to last month, quarter, and year. And dig deeper to see which of your products are used the most, deposits and withdrawals over time, and earnings by product and over time.

Overview Page
The dashboard opens to the Overview page, which shows metrics that help you evaluate the condition of your book of business. Select one of the key performance indicators (KPIs) on the left (#Clients, Total Financial Accounts, and so on) to trend it over a selected period. Scroll down to see AUM vs. Held Away and Client Segmentation, and to learn which are your top clients and households. Then click View Trend to see the trend for that metric in chart to the right. Here’s how to use other charts:
- Clients Trend chart to the right. Select a date range for the trend or select W, M, or Q to view trend by week, month, or quarter.
- Client Segmentation chart. Defaults to number of clients. Select Total $ to view by sum of balances for selected clients. Select Avg $ to view by average sum of balances for selected clients.
- Who are my top clients and households? chart. Defaults to show AUM (assets under management). Change the filter selection to view by another KPI, such as Held Away and Wallet Share.
Product Portfolio Mix Page
Provides insight into which products provide opportunities to boost sales, based on current and historic mix. Click a Product Family or Product bar in the chart on top to view metrics for just that part of your product mix. Defaults to Total $, which shows the sum of balances for selected clients. Select Avg $ to view by average sum of balances for selected clients. Select # to view by number of clients.
The Product Mix Over Time chart defaults to showing your product mix for all time. You can change that to a specific time period by changing the Date Range filter.
Transactions Page
View your portfolio inflow and outflow according to selections in the filters along the top. Defaults to showing the past 12 weeks. Click M to view by month, Q to view by quarter. Also, see which clients have made large deposits and withdrawals. Select a transaction type to focus on credits or debits, or change the date range to view changes during a specific time period. The page also shows the following:
- Top section
- Total Deposits. Sum of client deposit amounts.
- Total Withdrawals. Sum of client withdrawal amounts.
- Net. Total deposits - total withdrawals.
- Clients with Large Deposits and Withdrawals chart. Defaults to sorting from large to small withdrawals. Select Deposits to sort from large to small deposits.
Earnings and Fees Page
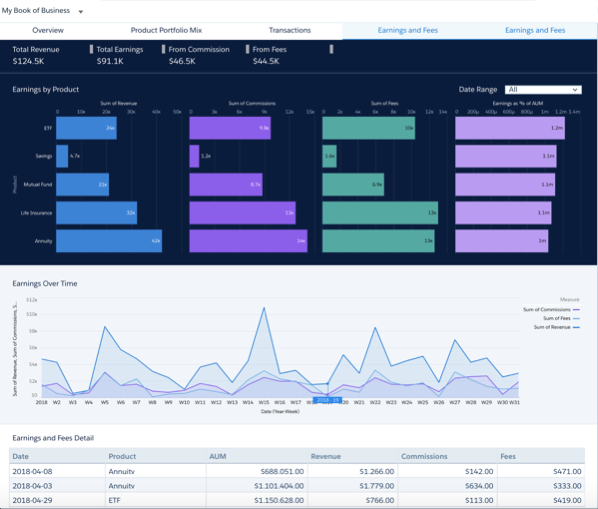
See revenues, commissions, fees, and earnings as percentage of AUM for the entire organization or a selected advisor, according to selections from filters along top. Defaults to all time. Zero in on a specific time period by changing the Date Range filter. Charts show the following:
- Earnings by Product chart. Shows revenue, commissions, fees, and earnings as percent of AUM for all your financial products.
- Earnings Over Time chart. Shows earnings over time. Defaults to 31 weeks. Focus on a time period by changing selection in Date Range filter in the Earnings by Product chart.
