
You are here:
Use the Team Book of Business Dashboard (Managed Package)
Provides a team view of the book of business. Start with a top-level view of total and per-client/per-advisor average assets under management (AUM), value of accounts, number of clients, and average wallet share. Filter by city, state, and advisor to refine your view. Then dive into details in the dashboard’s pages.

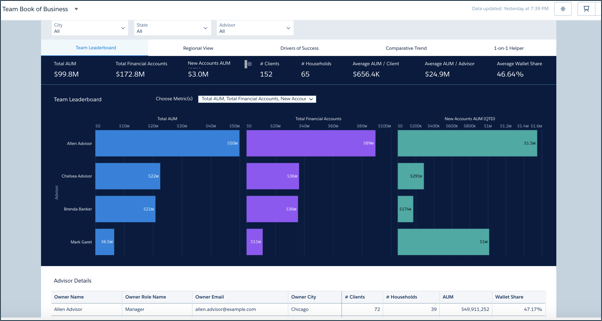
Team Leaderboard Page
Opens to the Team Leaderboard page and its leaderboard. Defaults to ranking members of your team by total AUM, total financial accounts, and new AUM. View other metrics by making selections in the Choose Metric(s) filter. View details about each advisor in the table below the leaderboard.
Metrics in Choose Metrics filter
- Total AUM. Total of assets under management.
- Total Financial Accounts. Sum of financial accounts for households.
- New Accounts AUM (QTD). Total of assets under management for accounts opened in current quarter.
- Total AUA. Total assets under advisement.
- # Clients. Total number of clients.
- # Households. Total number of households.
- Average AUM/Client. Sum of AUM / Number of clients.
- Average AUM/Household. Sum of AUM / Number of households.
- Average Wallet Share. Average wallet share
Regional View Page
Ranks performance by state and city. Defaults to measuring performance according to AUM. Use the Choose Metric filter to view performance according to other metrics. Click an element from either the By State or Top Cities charts to view details about advisors in those locales.
Drivers of Success Page
View correlations between various factors and performance. Use the filters at the top to select metrics for an activity, lead/referral, or opportunity, a time period, and a KPI. Chart then shows you how the activity, lead/referral, or opportunity metric influences the selected KPI for that time.
Metrics in first Explore the relationship between filter
- Activity: # Activities. Count of activities.
- Activity: # Meetings. Count of meetings.
- Activity: # Emails. Count of emails.
- Activity: # Calls. Count of calls.
- Lead/Referral: Average Days Until First Touch. Days between date of creation of lead and date of first activity.
- Lead/Referral: Average # Touches. Average touches per lead.
- Lead/Referral: Average Days Until Conversion. Average number of days between date of creation and date of conversion.
- Lead/Referral: Conversion Rate. Converted leads / Total leads.
- Opportunity: # of Opportunities Created. Count of opportunities.
- Opportunity: # of Opportunities Closed Won. Count of opportunities with status of Closed Won.
- Opportunity: Win Rate. Opportunities with status of Close Won / Opportunities
- Opportunity: Average Days Until Closed Won. Average of the opportunity age for opportunities with status of Closed Won.
- Client: Average # of Goals Per Client. Count of goals / Number of clients.
- Client: Average # of Financial Accounts. Count of financial accounts / Number of clients.
Comparative Trend Page
Click a bar for advisors in the left-hand chart to view their performance over time in the right chart. Defaults to showing weekly performance according to AUM. Change the selection in the Choose Metric filter to view performance by other metrics. Change the period for the trend with the Date Range filter, or change the time segment from weekly to monthly by clicking M or Q.
1-on-1 Helper Page
Provides performance metrics and rankings for advisors on your team to help you get ready to coach them. Select an advisor from the menu at top-center or click a bar next to their name in a chart to view KPIs for the advisor. KPIs include AUM, total value of financial accounts, average wallet share, referral conversion rate, and more.
