
You are here:
Debug an Issue
You can debug an issue by using the simulator app in VS Code based Modeler.
Required Editions
| Available in Lightning Experience in Professional, Unlimited, and Enterprise Editions that have Consumer Goods Cloud enabled |
| User Permissions Needed | |
|---|---|
| To debug an issue: | Customizer, Admin |
Before you debug an issue using the Modeler simulator app, ensure that the simulator is configured for debugging.
-
Run this command in your Modeler workspace to start the local server for your simulator:
sf modeler workspace server start - To view the simulator app in online mode, open the URL http://localhost:3000/framework/index.html?desktop in a Google Chrome browser in incognito mode.
- At the login prompt, enter sales rep credentials. This will start the synchronization of data from Salesforce to Modeler.
- Launch Developer Tools in the Chrome browser. Right-click anywhere in the browser and click Inspect. Alternatively, in your browser, click More Tools, and then select Developer Tools.
-
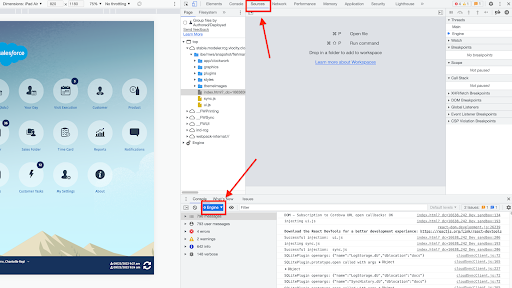
On the Source tab, select the thread as Engine.
 Note You can ignore initial errors such as non-retrieval of the profile photo.
The image shows the Engine thread on the console section of the Source tab.
- After the sync completes successfully,, open the Consumer Goods Offline mobile app on the simulator, and then go to the module or card where the issue exists.
- To retrieve the process being run, the UI being used, and the objects that were loaded for the process, in the console section of the Sources tab, use the relevant JavaScript command.
- Open the process file and identify the object with the issue.
- To examine the identified object, from the Sources tab’s menu, select Open File, or press Command+P (macOS) or Control+P (Windows).
-
Enter the object name, and then select the function file with the issue.
The JavaScript code of the function for the object appears.
- Add breakpoints at the appropriate line numbers of the code.
- Reload the app and reproduce the issue in Consumer Goods Offline mobile app with the help of the Modeler simulator.
The simulator stops the business flow at the breakpoints that you specified so that you can debug the issue.
Use the navigation buttons, such as play, step over, step in, or step out during the debugging. You can enter a validation command to the source object in the console wherever necessary.
Did this article solve your issue?
Let us know so we can improve!
