
You are here:
Configure Modeler for Debugging
Prepare Modeler for debugging.
Required Editions
| Available in Lightning Experience in Professional, Unlimited, and Enterprise Editions that have Consumer Goods Cloud enabled |
| User Permissions Needed | |
|---|---|
| To configure Modeler: | Customizer, Admin |
-
If you are logging into a new org, perform these steps:
-
To clean your workspace, run:
sf modeler workspace cleanup -
To build your workspace, run:
sf modeler workspace
        build
-
To clean your workspace, run:
-
Start the local server in your Modeler workspace to open the simulator app. Run:
sf modeler workspace server startA log message appears indicating that the backend server has started. The log message also includes the URL using the port configured in your workspace.This is the URL generated using the default port http://localhost:3000/framework/index.html?desktop. - To view the simulated UI in online mode, open the default URL or the URL returned in the log message in a Google Chrome browser in incognito mode.
-
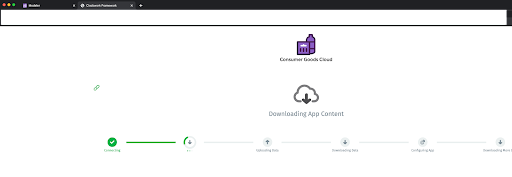
At login prompt, enter sales rep credentials and complete the synchronization of data to
Modeler.
The image shows the sync screen of the Modeler app.
- Launch developer tools in the Chrome browser. Right-click in the browser and click Inspect. Alternatively, in your browser, click More Tools, and then select Developer Tools.
-
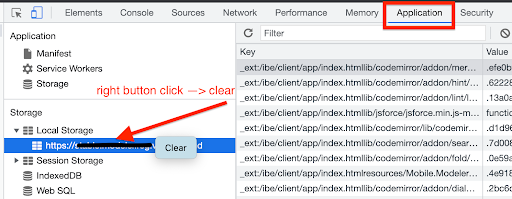
To remove org or user data, clear your local storage. The image shows how to clear local
storage from the Application tab in the Chrome DevTools.
- On the Network tab, click Preserve Log.
-
To enable the log settings:
-
Click or tap thrice on the sync or app UI area on the browser. A debug window
appears.
If you aren’t able to view the sync screen, press the triple tab on the current screen.A debug window appears.
-
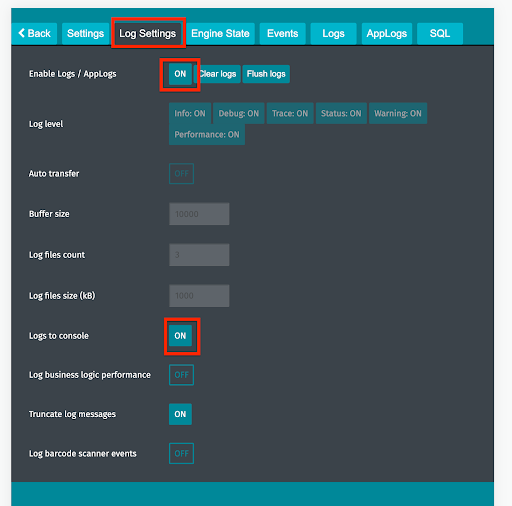
In the Log Settings tab, turn on the Enable Logs / App
Logs and the Logs to Console settings.
The image shows the Log Settings page with the enabled settings on the debug window.
-
Click Back.
After the sync is complete, the landing page of the offline mobile app appears. If the sync is still in progress, you’re shown the sync screen.
-
Click or tap thrice on the sync or app UI area on the browser. A debug window
appears.
Did this article solve your issue?
Let us know so we can improve!
