
You are here:
Campaign Statistics Activity Timeline
Use the activity timeline to view campaign changes, states, and statistics.
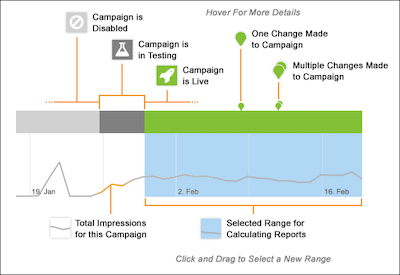
When viewing the activity timeline, keep the following in mind:
- A pin icon indicates campaign changes. One pin indicates one campaign change. Multiple pins indicate multiple campaign changes.
- The colored bar above the graph indicates the campaign state. Green is the time the campaign is published. Gray indicates the campaign is disabled.
- The white background color on the graph indicates the section of total recorded campaign impressions. The blue background indicates the range selected for reports calculation.
Did this article solve your issue?
Let us know so we can improve!
