
You are here:
Confidence Explained in Campaign Statistics
Confidence on the Campaign Statistics screen refers to the term statistical confidence. It’s a measure of how sure you are of your results from an A/B test. It isn’t a measure of how effective a campaign was, but a measure of how certain you can be with the campaign’s displayed impact.
Bayesian Statistics
The numbers you see in Campaign Statistics are reported based on mathematical and statistical concepts from Bayesian statistics. The data provided for your Personalization campaign only has a confidence rating when both the test and control groups have 35 goal completions.
Example
A test group is a group of visitors who see a campaign experience they qualify for. A control group is a group of visitors who don’t see a campaign they qualify for. Suppose you publish a campaign with 50% of your visitors in the test group and 50% in the control group. After 2 weeks of running the campaign, you see these conversion rates each day:
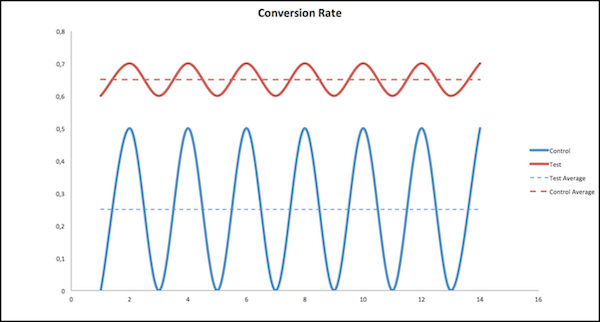
Conversion rates vary each day. Some days conversions are higher, and other days conversions are lower.
The test group has a higher conversion rate than the control group. And the average for the test group is much higher than the average for the control. Also, control group conversion rates range from a minimum of 0 and a maximum of 0.5. In contrast, the test group has a minimum of 0.6, so it never falls into the control group’s conversion rate range. Because there’s no crossover between test and control conversion, there’s high confidence that the test group has a higher conversion rate than the control group.
