You are here:
View Guardian Signals
Signals are Guardian’s way of alerting you when a metric falls outside of a predicted range for the seasonal daily and weekly activity for your site and dataset. Using signals, Guardian can provide either positive or negative indications of how metrics are impacting your digital property.
Required Editions
| Permissions Needed | |
|---|---|
| To view Guardian data: | All roles |
From the Guardian Signals tab, you can:
- View signals for different selected time periods.
- Sort signals by their impact, duration, or when they started.
- Filter signals by their related Guardian topics.
By default, all available topic types are enabled in the Signals tab.
| Topic Type Filter | Description |
|---|---|
| Revenue | Show signals only for topics that have an impact on revenue. |
| Visits | Show signals only for visit topics. |
| Open Time | Show signals only for open time email-related topics. |
| Segments | Show signals only for segment topics. |
| Recipe | Show signals only for Einstein recipe-related topics. |
| Global | Show signals only for topics that impact your entire digital property and aren’t restricted to a specific segment or campaign. |
When viewing data pioints in signal graphs, note the meanings for each indicator.
| Indicator | Description |
|---|---|
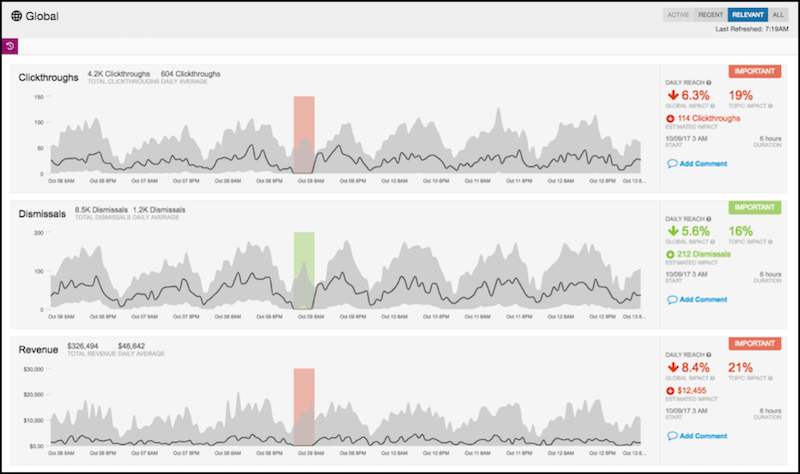
| Gray line | The range for predicted behavior for the metric. |
| Black line | The actual behavior on your digital property for the metric. |
| Red dot | The low end of the prediction. |
| Green dot | The high end of the prediction. |
| Red bar | The start, end, and duration of behavior below the predicted range. |
| Green bar | The start, end, and duration of behavior above the predicted range. |
- To open the Guardian dashboard, click the purple Guardian shield.
- Click the Signals tab.
- (Optional) In the upper right corner of the page, adjust the time period.
- To sort signals, click the Sort Signals by dropdown and choose an option.
- To change the number of signals that appear on the page, click the Signals Listed dropdown and select a value.
- To view signals that occurred within the past hour or are still occurring, select Active.
- To view both active and inactive signals that occurred within the selected time period, select Recent (the default setting).
- To filter signals associated with a topic type, click the tile for that topic type.
- To filter by metric, click Visit Counts and Events & Performance.
- To see more details, double-click a signal.
- To see details for data points, hover over the graph.
- To zoom in on a time period, click and drag over that section of the graph.
- To reset the graph to the original time period, click Reset Zoom.
- To view signal history for the previous five days, click History.
- To comment on a signal in History, click +Comment.
- To view signals by their state, select an option under Signal Status.

Sometimes, multiple signals that happen concurrently can be related, like a decrease in orders that creates a reduction in revenue. Other times, the signals are independent of each other. You can view signals that happen at the same time so you can understand how events are impacting your digital property. In the example image, the signals appear to be directly related: Clickthroughs are down at the same time that Dismissals are up, which appears to have negatively affected Revenue.