
You are here:
Day and Time Report
Visually analyze trends or traffic spikes using the Day and Time report. This report provides view options for total visitor count, average length of visit time, total revenue, average revenue across each visit, and the bounce rate. Each dot on the graph represents an hour in a day.
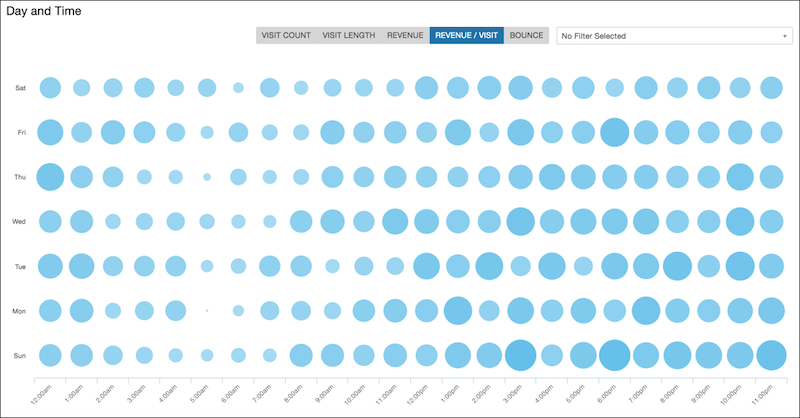
Hover over a dot to reveal more details about that time period. You can define the date range and apply filters to narrow the results by campaign and by other criteria.
The Day and Time report includes these views.
| View | Description |
|---|---|
| Visit Count | Number of total visitors |
| Visit Length | Average visit length |
| Revenue | Total revenue |
| Revenue/Visit | Average revenue across each visit |
| Bounce | Bounce rate |
Did this article solve your issue?
Let us know so we can improve!
