
You are here:
Read Cohort Reports
Cohort reports give quick visual cues about a cohort’s pattern. Use the report to group visitors by different time periods, so you can view the data from different perspectives.
Example Cohort Report
This example cohort report groups visitors by the week that they first visited your site in January 2018. The report shows how long it took each group to first perform the View Item activity each week.
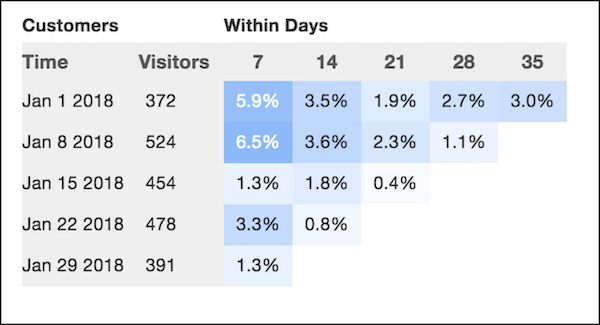
This example shows the following:
-
Of the 372 visitors who came to the site during the week of January 1, these percentages of visitors performed the View Item activity:
-
5.9% within 7 days of their first visit.
-
3.5% within 14 days of their first visit.
-
1.9% within 21 days of their first visit.
-
2.7% within 28 days of their first visit.
-
3.0% within 35 days of their first visit.
-
-
Of the 391 visits during the week of January 29, 1.3% of visitors completed the View Item activity within 7 days of their first visit.
Heat Map
Cells are shaded to give a quick visual cue to the general pattern of the cohort. This shading, called a heat map, can help you draw quick conclusions without reading the numbers.
When reading Cohort reports, keep the following in mind:
The darkest color is assigned to the cell with the largest value.
The remaining cells are shaded on a linear scale proportional to the largest valued cell.
Cells with 0.0% are white.
Cohorts are a great way to see patterns of behavior. For instance, the highest percentages of visitors completed the View Item activity within a week of their first visit. Also, the cohort report indicates that small percentages of visitors typically complete the View Item activity, but more visitors completed the activity during the week of January 8.
Consider what occurred on the site that week. Was there a new promotion during the week of January 8 that motivated visitors to complete the View Item activity? If this promotion was removed or changed the next week, it could explain why numbers returned to average for the site during the week of January 15.
