You are here:
Reports Dashboard
Gain insights about visitor and campaign activity on your site using the Reports Dashboard. Depending on your industry or function, the Reports Dashboard provides different sections. If you track transactions in the Personalization system, the dashboard shows Total Stats first. If you don’t track transactions in the Personalization system, Activity appears first. If your site tracks content views or product purchases, the dashboard shows the Items section at the bottom.
- Total Stats
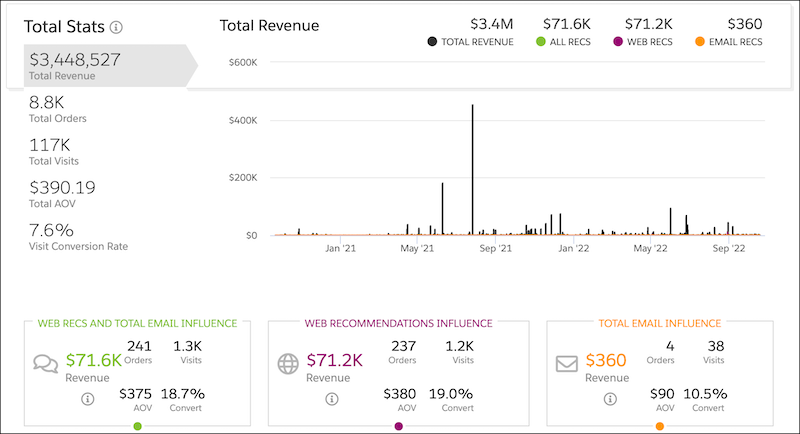
Total Stats shows daily revenue totals, a graph of total revenue for the selected time period, and a summary of revenue-generating activities on your site. And it includes statistics on the influence of web recommendations and email campaigns on your revenue numbers. Influenced revenue stats don’t reflect server side campaign activity or data. - Activity
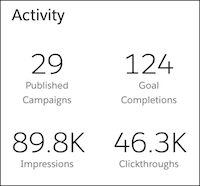
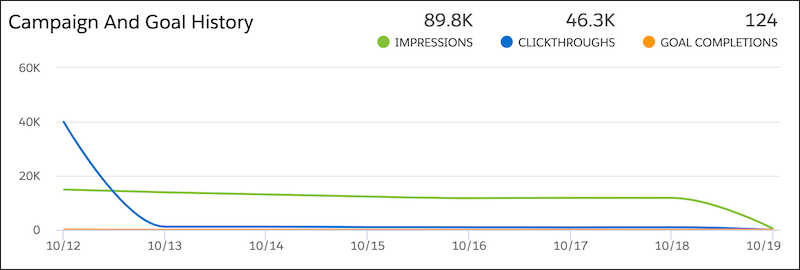
Activity includes an overview of campaign and goal completion statistics including trends for impressions, goal completions, and clickthroughs. - Campaign and Goal History
Campaign and Goal History shows a graph of the total number of impressions, clickthroughs, and goal completions across all campaigns based on the selected time period. - Top Campaigns
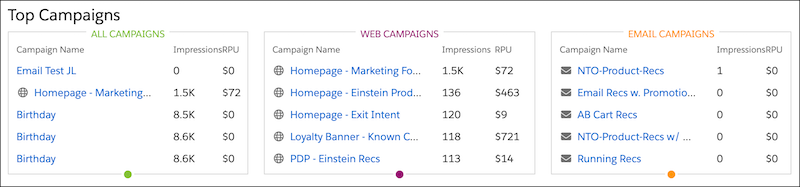
Top Campaigns lists the campaigns with the highest impressions and RPU, with links to each campaign. - Visitors
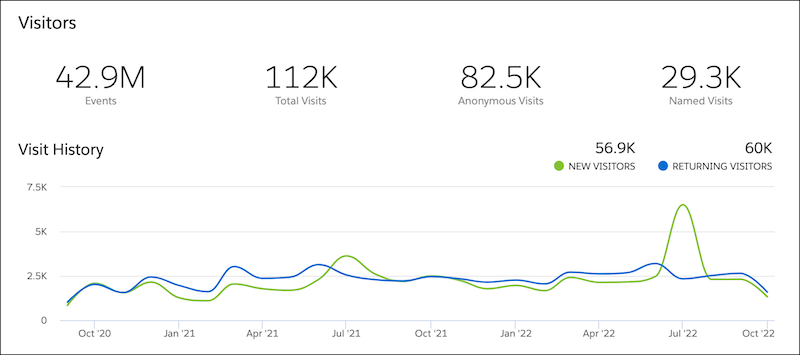
View the number of events, the total number of site visits, and a graphical timeline of the number of new and returning visitors. - Items
Items gives an overview of total product views, purchases, recommendations, and the number of adds to cart during the selected time period.
Total Stats
Total Stats shows daily revenue totals, a graph of total revenue for the selected time period, and a summary of revenue-generating activities on your site. And it includes statistics on the influence of web recommendations and email campaigns on your revenue numbers. Influenced revenue stats don’t reflect server side campaign activity or data.
Activity
Activity includes an overview of campaign and goal completion statistics including trends for impressions, goal completions, and clickthroughs.
Campaign and Goal History
Campaign and Goal History shows a graph of the total number of impressions, clickthroughs, and goal completions across all campaigns based on the selected time period.
Top Campaigns
Top Campaigns lists the campaigns with the highest impressions and RPU, with links to each campaign.
Visitors
View the number of events, the total number of site visits, and a graphical timeline of the number of new and returning visitors.
This report also shows how many visitors were known and how many were anonymous during a period. Known or named visitors have a profile with a stored, configured Personalization identity type. Anonymous or unknown visitors don’t have a stored, configured identity type.