To gauge how well your engagement program nurtures your prospects, review program
metrics in the Report tab of a running or paused program. Tools are available in the toolbar,
the canvas, and on individual cards.
Required Editions
Available in: All Account
Engagement Editions
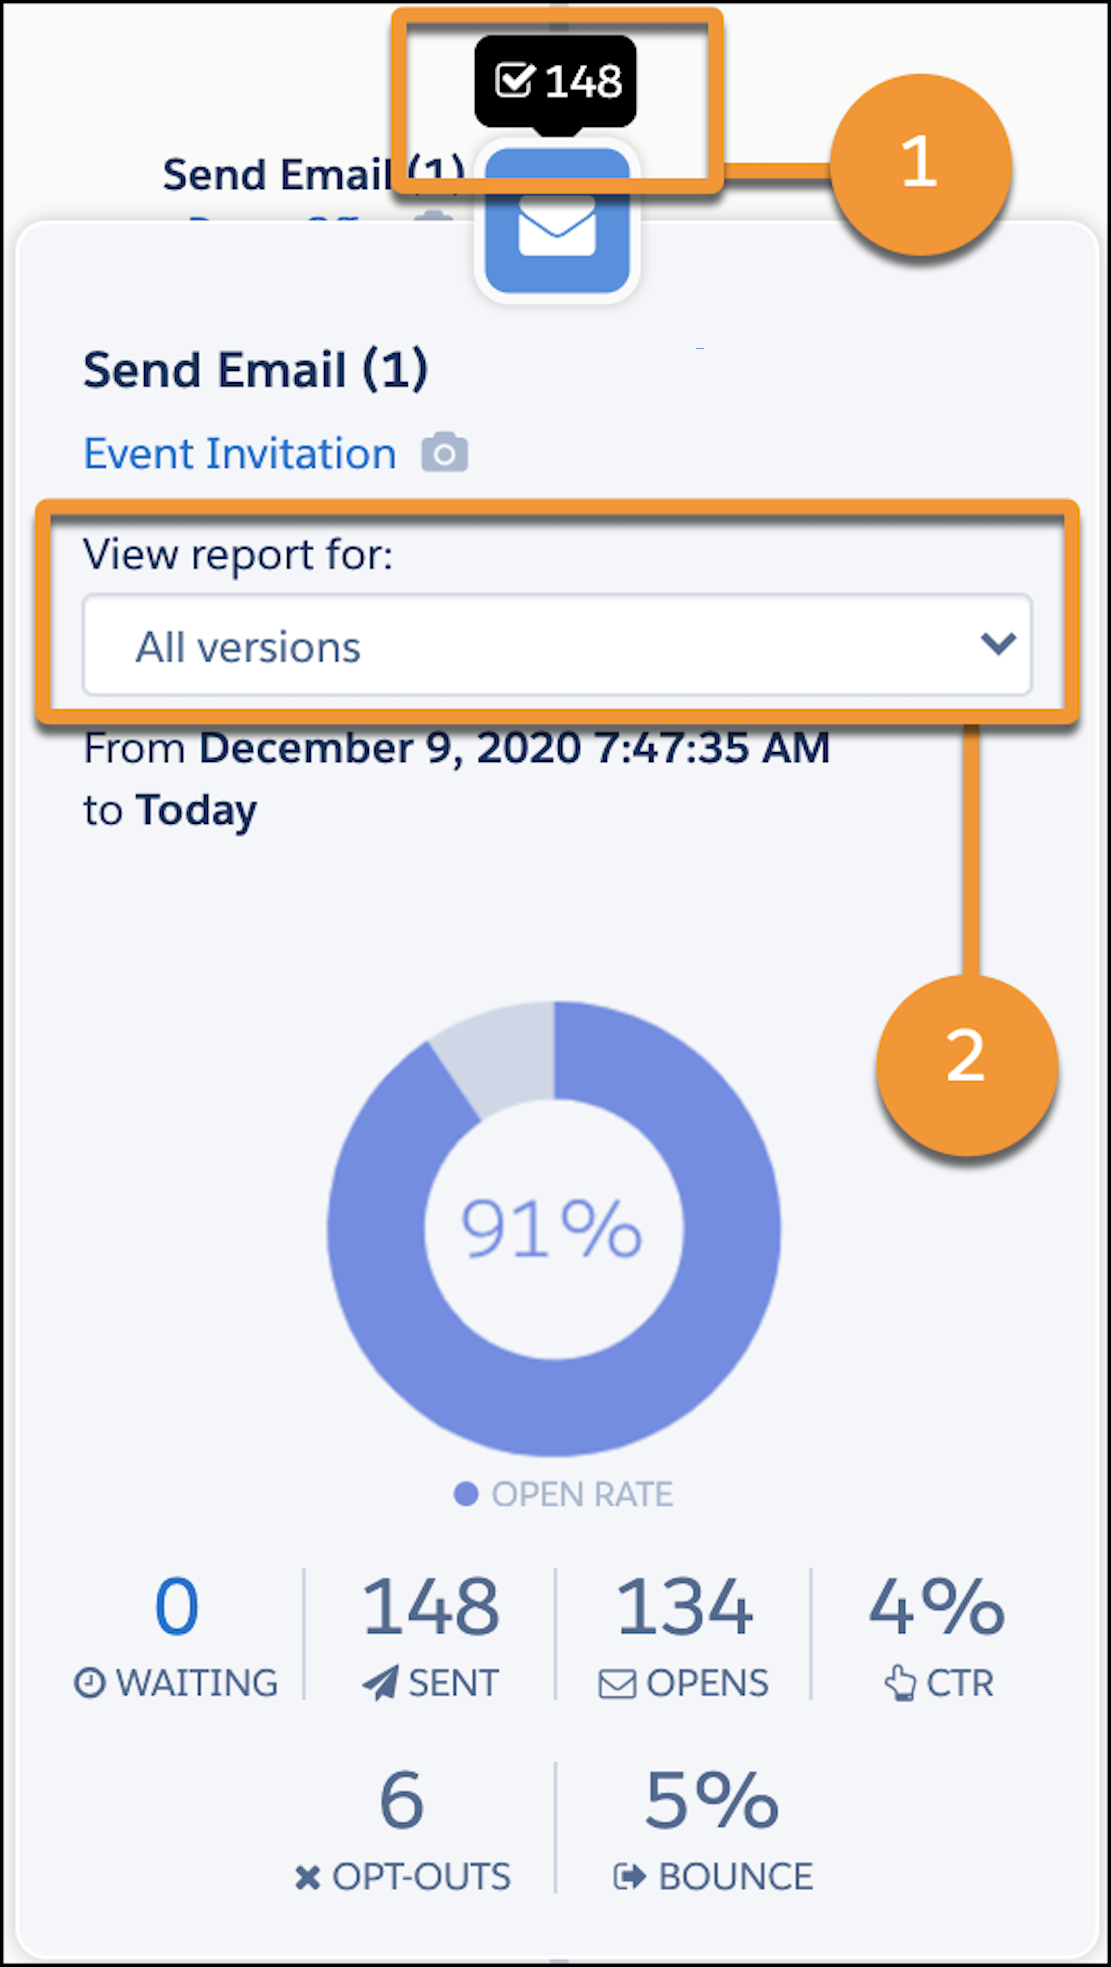
Each step of your program shows a tooltip with high-level metrics based on prospects who have
completed the step. To access more detailed metrics, click the step to open its Report Card.
The Report Card shows basic metrics including the number of prospects queued on the step (1).
To see only a specific version of your engagement program, select one from the report view
dropdown (2).
To download your program report as a CSV, click Tools and then
CSV Export. The export contains all versions of your program,
including the total number of prospects started and completed, percentage completed, step
type, step name, and asset name.
On the canvas, you can set a date filter to show data for a specific time frame. When you
filter by date, the tooltip and exports show only the activities that occurred during that
time.
Here are a few additional things to note about step metrics in Engagement Studio
reports.
Metrics don’t include information for prospects who are currently waiting on that
step.
When you filter by date, the tooltip and exports show only the activities that occurred
during that time. For example, you set a date range of Tuesday through Friday to see how
prospects engaged with an email you sent on Monday. The statistics show 0 email sends
because emails were sent only on Monday, and the report shows the number of opens from
Tuesday through Friday.
Like other email reports in Account Engagement, open and click-through rates are based
on delivered emails.
Did this article solve your issue?
Let us know so we can improve!
Loading
Salesforce Help | Article
Cookie Consent Manager
Cookie Consent Manager
General Information
Required Cookies
Functional Cookies
Advertising Cookies
General Information
We use three kinds of cookies on our websites: required, functional, and advertising. You can choose whether functional and advertising cookies apply. Click on the different cookie categories to find out more about each category and to change the default settings.
Privacy Statement
Required Cookies
Always Active
Required cookies are necessary for basic website functionality. Some examples include: session cookies needed to transmit the website, authentication cookies, and security cookies.
Functional Cookies
Functional cookies enhance functions, performance, and services on the website. Some examples include: cookies used to analyze site traffic, cookies used for market research, and cookies used to display advertising that is not directed to a particular individual.
Advertising Cookies
Advertising cookies track activity across websites in order to understand a viewer’s interests, and direct them specific marketing. Some examples include: cookies used for remarketing, or interest-based advertising.