You are here:
Using the Personalization Attribution Intelligence Dashboard
Use Attribution Intelligence dashboards in Salesforce Personalization to view funnel stage conversions related to a specific attribution model and analytic totals for each stage.
Global Filters
The filters for Personalization Point, Recommender, and timeframe selection in the first section of the Analytics tab are global. Modifying any of these values affects the display of all dashboard metrics.
Funnel Stage Conversion
The second section of the attribution dashboard shows funnel stage conversion metrics. The stages shown for the conversion funnel reflect the engagement signals (stages) configured for the specific attribution model selected. The values display total stage counts and conversion rates from one stage to the next.
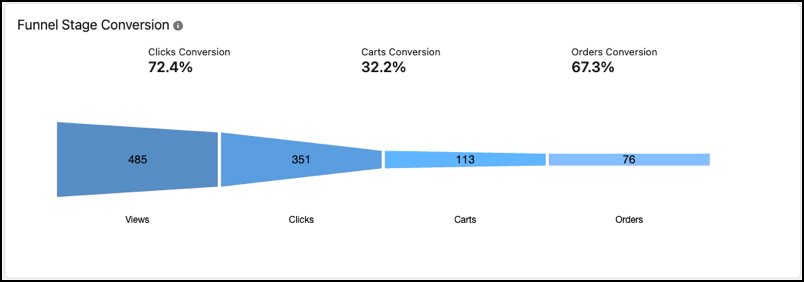
When interpreting funnel stage conversion results, keep these considerations in mind:
- Each attribution model can have different stages and different numbers of stages. For these reasons, the labels for the Funnel Stage Conversion section can be different for each attribution model.
- Funnel conversion always progresses from left (the entrance) to right (the exit).
- The entrance to the funnel always shows the total number of individuals who have started the conversion journey. As individuals progress through the funnel, the total number of individuals typically decreases at each juncture, showing the total number of conversions at each stage.
- The conversion rate for a stage appears as a percentage as compared to the previous stage. For predefined configurations, Views shows total individuals, Clicks shows percent conversion of clicks/views, Carts shows percentage conversion of carts/clicks, and Orders shows percentage conversion of orders/carts.
Attribution Tables
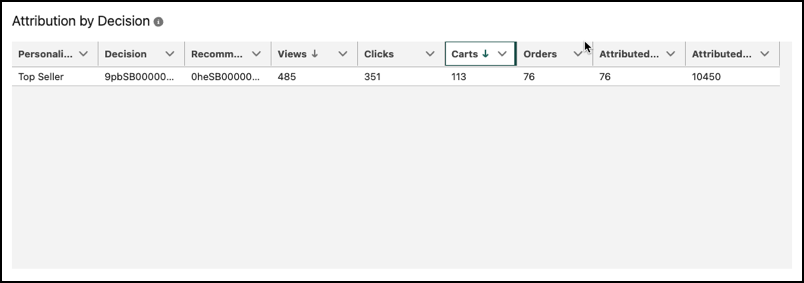
The tables in the third and fourth sections of the dashboard show attributions by decision and by content, respectively.
The Attribution by Decision table always includes the Personalization Point, Decision, and Recommender columns by default.
The Attribution by Content table always includes the Personalization Point, Decision, Recommender, and Content ID columns by default.
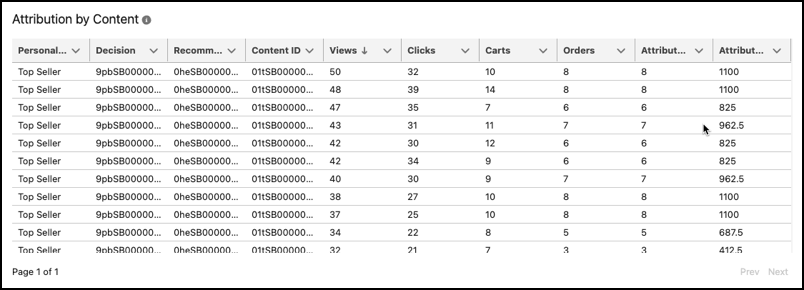
All other columns in each table reflect the engagement signals (stages) configured for the specific attribution model selected.
