You are here:
Using the Personalization Pipeline Intelligence Dashboard
Use the Personalization Pipeline Intelligence dashboard to gain insights around the health and usage of your personalization pipeline.

The Date Range filter in the upper right-hand corner of the dashboard is global. Modifying this filter changes the timeframe used to display all dashboard metrics.
Request and Personalization Point Metrics
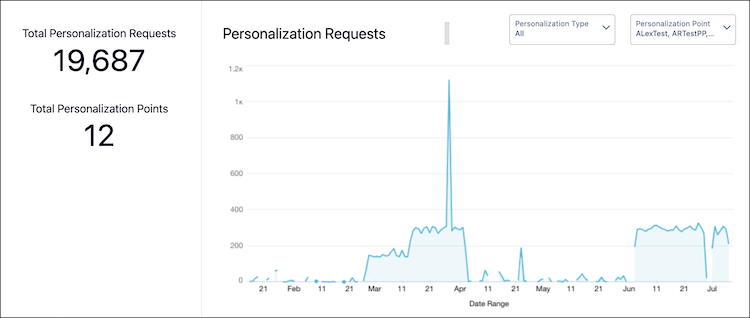
The top section of the dashboard shows total request and total personalization point metrics. You can filter Personalization Request or Personalization Point metrics by personalization type or for a specific personalization point.
| Metric | Description |
|---|---|
| Total Personalization Requests | The total number of requests serviced by a personalization point or group of personalization points. |
| Total Personalization Points | The total number of unique personalization points serviced over the personalization pipeline. |
This section provides a graphical view of personalization request or personalization point metrics based on your selected date range and filter settings. Clicking Total Personalization Requests or Total Personalization Points toggles the graph to show data for that metric over the specified date range and using any selected filter settings.
Daily Uniques Individual Metrics
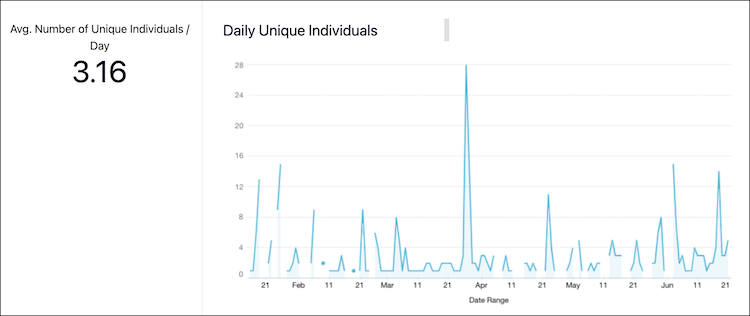
The middle section of the dashboard shows daily unique individual metrics. These are individuals whose activity has resulted in personalization service.
| Metric | Description |
|---|---|
| Avg. Number of Unique Individuals / Day | The total number of unique personalization points serviced over the personalization pipeline. |
This section provides a graphical view of daily unique individuals for the specified date range.
All Data Table
The bottom of the dashboard provides metrics in a table based on the specified date range and using any selected filter settings.
| Metric | Description |
|---|---|
| Personalization Point | The name assigned to the personalization point when it was created. |
| Personalization Point ID | An auto-generated ID assigned to the personalization point when it was created. |
| Personalization Decision | The name assigned to the personalization point when it was created. |
| Personalization Decision ID | An auto-generated ID assigned to the personalization decision when it was created. |
| Personalization Requests | The total number of personalization requests serviced by the personalization point within the selected timeframe. |
