
You are here:
Set Up Apex Class and Trigger Trace Flags
You can set up an Apex class or trigger trace flag in Salesforce Setup, in the Developer Console, or by creating Tooling API objects with Salesforce CLI commands. These trace flags have the CLASS_TRACING debug log type and override the debug log levels of the USER_DEBUG and DEVELOPER_LOG trace flags.
Required Editions
| Available in: Salesforce Classic (not available in all orgs) and Lightning Experience |
| Available in: Enterprise, Performance, Unlimited, Developer, and Database.com Editions |
| User Permissions Needed | |
|---|---|
| To use the Developer Console: | API Enabled AND View All Data |
| To view, retain, and delete debug logs: | View All Data |
| To execute anonymous Apex: | Author Apex |
| To save changes to Apex classes and triggers: | Author Apex |
| To use Salesforce CLI and run Tooling API queries: | API Enabled |
Tip For an applied example of using Apex class and trigger trace flags, see Debug Log Filtering for Apex Classes and Apex Triggers.
Create Apex Class and Trigger Trace Flags in Setup
Note Although you can set up an Apex class or trigger trace flag in Setup, these trace flags
don’t appear in the log list on the Debug Logs page. The page shows only
USER_DEBUG and DEVELOPER_LOG log types, not
CLASS_TRACING log types. You can still access CLASS_TRACING
log types created in Setup from the Apex class or trigger’s Setup page, from the Developer
Console, or with Tooling API.- From Setup, enter Debug Logs in the Quick Find box, and then click Debug Logs.
- Click New.
- For Traced Entity Type, select Apex Class or Apex Trigger.
- For Traced Entity Name, enter the name of the Apex class or trigger that you want to add a trace flag to.
- To define a time period during which the trace flag is active, enter a Start Date and an Expiration Date.
-
To set a debug level profile, either enter the name of a debug level profile that you’ve
already defined, or click New Debug Level.
If you click New Debug Level, a new window opens. To define a new debug level profile, in the new window, enter a name for the debug level profile. Then select a debug log level for each debug log category. Save your changes.
- Save the trace flag.
View, Edit, or Delete Apex Class and Trigger Trace Flags in Setup
-
Navigate to the appropriate Apex class or trigger Setup page.
- For Apex class trace flags, from Setup, enter Apex Classes in the Quick Find box, and then click Apex Classes.
- For Apex trigger trace flags, from Setup, enter Apex Triggers in the Quick Find box, and then click Apex Triggers.
- Click the name of the Apex class or trigger that you want to examine.
-
Click the desired option.
- To create a trace flag, click New. Then enter a start date, an expiration date, and a debug level profile for the trace flag.
- To delete a trace flag, in the trace flag’s Action column, click Delete.
- To modify a trace flag’s start date, expiration date, or debug level profile, click Edit.
- To modify a trace flag’s debug levels, click Filters. Then select the desired debug level for each category.
- To delete all trace flags for the Apex class or trigger, click Delete All.
- Save your changes.
Create Apex Class and Trigger Trace Flags in the Developer Console
-
From the Developer Console, click Debug | Change Log Levels….
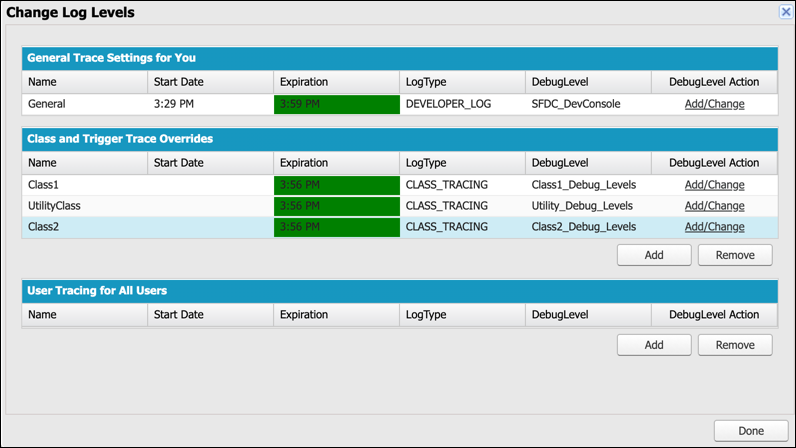
- In the Class and Trigger Trace Overrides section, click Add.
- Select the class or trigger that you want to add a trace flag to.
- To define a time period during which the trace flag is active, click the Start Date cell for the class or trigger, and then enter or select a valid start time. Then click the Expiration Date cell and enter or select a valid end time.
-
To set a debug level profile, click Add/Change in the DebugLevel
Action cell for the class or trigger. Then perform one of these actions.
- To set the debug level to a debug level profile that you already defined, click the name of the debug level profile so that its row is highlighted. Then click Done.
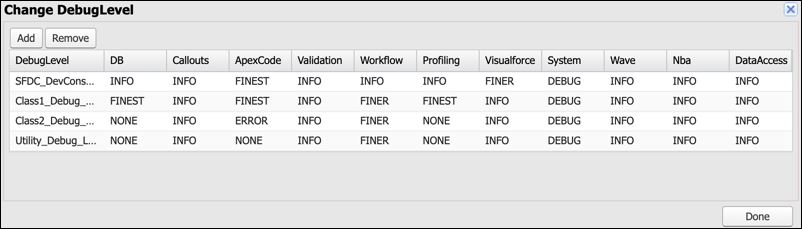
- To adjust the debug levels of a debug level profile that you already defined, click the name of the debug level profile so that its row is highlighted. Select a new debug level from the dropdowns for each debug log category that you want to adjust. Then click Done.
- To add a new debug level profile, click Add. In the new window, enter a DebugLevel Name. Then select a debug level from the dropdowns for each debug log category. Click Add, and then click Done.
-
To delete a debug level profile, click the name of the debug level profile, and then
click Remove. Then click Done.
Warning: This action removes the debug log profile from all of its assigned trace flags.
Create Apex Class and Trigger Trace Flags Using Salesforce CLI Commands
Note Where possible, we changed noninclusive terms to align with our company value of Equality.
We maintained certain terms to avoid any effect on customer implementations.
-
If you don’t have an existing debug level profile that you want to use, first create a
DebugLevel record with Tooling API by using the
sf data create recordcommand. Replace the placeholder values with the desired name of the debug level profile and the desired debug level for each debug log category.sf data create record --use-tooling-api --sobject DebugLevel --values "DeveloperName='DEBUG_LEVEL_PROFILE_NAME' MasterLabel='DEBUG_LEVEL_PROFILE_NAME' Workflow='FINER' ApexCode='FINE' System='DEBUG' Validation='INFO' Database='INFO' Callout='INFO' Visualforce='INFO' ApexProfiling='INFO'" -
Get the
DebugLevelrecord ID for the debug level profile by using thesf data querycommand. Replace the placeholder value with theDeveloperNameof the debug level profile.sf data query --query "SELECT Id FROM DebugLevel WHERE DeveloperName='DEBUG_LEVEL_PROFILE_NAME'" -
Get the ID of the Apex class or trigger that you want to trace by using the
sf data querycommand. Replace the placeholder value with the name of the Apex class or trigger.sf data query --query "SELECT Id FROM ApexClass WHERE Name='APEX_CLASS_NAME'" -
Create a
TraceFlagrecord with Tooling API. Replace the placeholder values.sf data create record --use-tooling-api --sobject TraceFlag --values "TracedEntityId='APEX_CLASS_OR_TRIGGER_ID' DebugLevelId='DEBUG_LEVEL_ID' LogType='CLASS_TRACING' StartDate='START_TIME_UTC' ExpirationDate='END_TIME_UTC'" -
If you haven’t already, create another
TraceFlagrecord on the user whose actions you want to trace. Apex class or trigger trace flags don’t generate debug logs on their own.sf data create record --use-tooling-api --sobject TraceFlag --values "TracedEntityId='USER_ID' DebugLevelId='DEBUG_LEVEL_ID' LogType='USER_DEBUG' StartDate='START_TIME_UTC' ExpirationDate='END_TIME_UTC'"
To work with debug logs, use these commands:
- To fetch the specified log or given number of most recent logs from the org, use the
apex get logcommand. - To display a list of IDs and general information about debug logs, use the
apex list logcommand. - To activate a debug log for the current user and stream the debug log to the console, use
the
sf apex tail og command.
Did this article solve your issue?
Let us know so we can improve!