Monitoring Workstream Usage in Summary View
The Summary view shows the consumption relative to the defined limits for the service territory if a service territory limit is defined and for all limited workstreams in selected territories for a specific day or week.
Required Editions
| Available in: both Salesforce Classic (not available in all orgs) and Lightning Experience |
| The Agentforce Field Service and Operations core features, managed package, and mobile app are available in Enterprise, Unlimited, and Developer Editions. |
The view provides a summary of the Work Capacity consumption relative to the limits of workstreams for which limitations exist in selected service territories at specific dates in hours and percentage. It also shows the total work capacity availability for the service territories on the selected dates.
To access the Summary view, from the App Launcher, find and select Work Capacity, and then select the Summary tab.
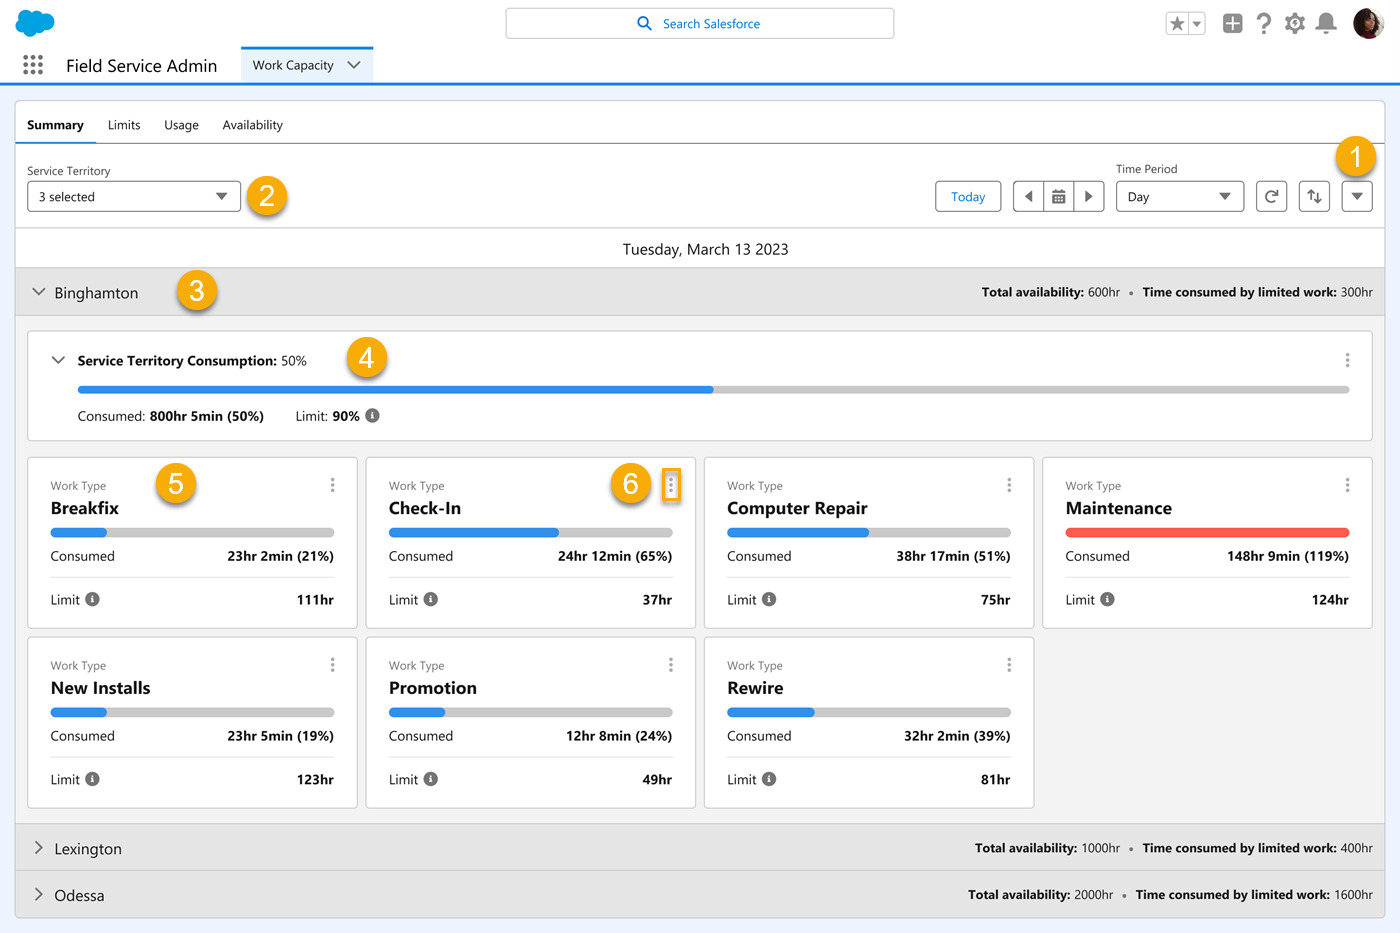
The Actions menu (1) provides direct access to:
- The Field Service Work Capacity Dashboard.
- Creating a work capacity limit. Refresh the view to show the new workstream card if you add a work capacity limit.
In the first panel (2):
- Select the service territories that have active work capacity limits you want to show in the Summary view. You can select only your service territories or service territories shared with you.
- Select the date.
- Select the display period: Day view or Week view (for a 7-day period starting at the selected date).
The second panel (2) provides a Work Capacity summary for each selected service territory for the selected time period.
- Total availability:
- All available resource hours for the service territory on the specific date (including idle time and scheduled time).The system admin can configure available hours to include overtime.
- Time consumed by limited workstream:
- The hours consumed by the workstreams that have work capacity limitations in a specific time period.
The third panel (3) changes according to the selected time period.david
In the Day view, the panel includes a card for the service territory limit if it’s defined (4) and cards (5) for all workstreams with a limit defined for this day (for example, the Work Type attribute with the Breakfix value). Each card includes a progress bar that visualizes the consumption of the limit on the workstream. When consumption exceeds 100% (for example, due to manual scheduling), the bar changes to red.
It also includes these values:
- Consumed:
- The number of hours consumed by this workstream and the percentage of time consumed relative to the limit.
- Limit:
- The limit set for the service territory or workstream in percentage of availability or in hours. If the limitation unit was set to hours, hover over the card to see the calculated percentage from the total availability. If the limitation unit is Percentage, hovering over the card shows the calculated hours.
If service appointments are scheduled for the day, the Actions menu in the card (6) enables you to directly update the daily work capacity limit for a workstream by updating the Work Capacity Usage record without changing the Work Capacity Limit object. Other daily instances of the limit aren’t affected. When you select the Edit Daily Limit action, the Edit Daily Limit dialog is shown, enabling you to type a new limitation value in the limitation unit of the defined limit (hours or percentage). The limitation value must be an integer equal to or greater than 0. You can’t update overridden limits or limits that are not enforced. If the Work Capacity Limit object is subsequently updated, updating the WCL overrides the change you made.
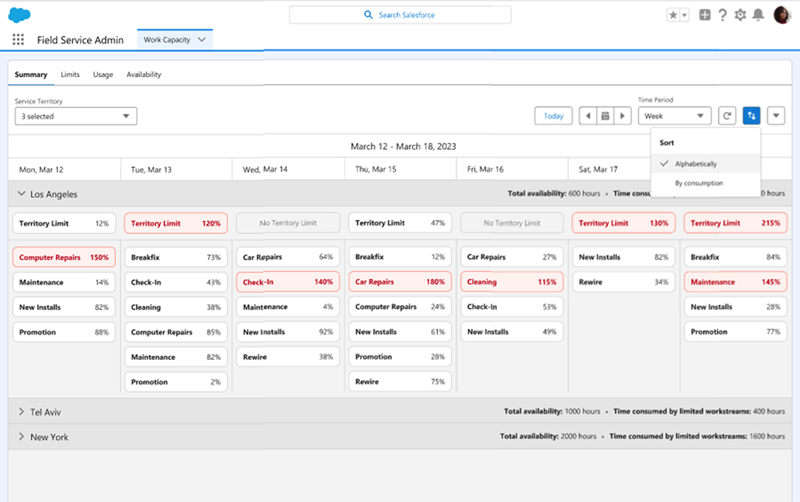
In the Week view, the panel is shown for each day of the week the service territory limit (Territory Limit) card if it is defined and limited workstream cards. The cards show the consumption as a percentage of the limit for that day. Hover over a card to show additional information. You can sort the workstreams with limits valid for each day of the week alphabetically or in descending order according to the current consumption in percentage of the availability. For example, let’s assume a daily limit of 100 hours for installation work next week and a 200-hour limit for breakfixes. The alphabetically sorted weekly view can alert the planner if only 20 hours are consumed for installations while breakfixes have reached the 200 hours limit, preventing additional breakfixes from being scheduled. The planner can then decrease the limit for installations and increase the limit for breakfixes to ensure better resource utilization.