These analytic dashboards focus on proactively identifying, troubleshooting, and
resolving performance bottlenecks to ensure platform stability. Users can pinpoint specific slow
Lightning pages, inefficient Apex code, and problematic API integrations, allowing them to
optimize the user experience.
Required Editions
Available in: Salesforce Classic (not available in all orgs), and Lightning
Experience
Available in: Enterprise, Performance, and Unlimited
Editions.
Requires Salesforce Shield or Salesforce Event Monitoring add-on
subscriptions.
The following analytic dashboards are available to users:
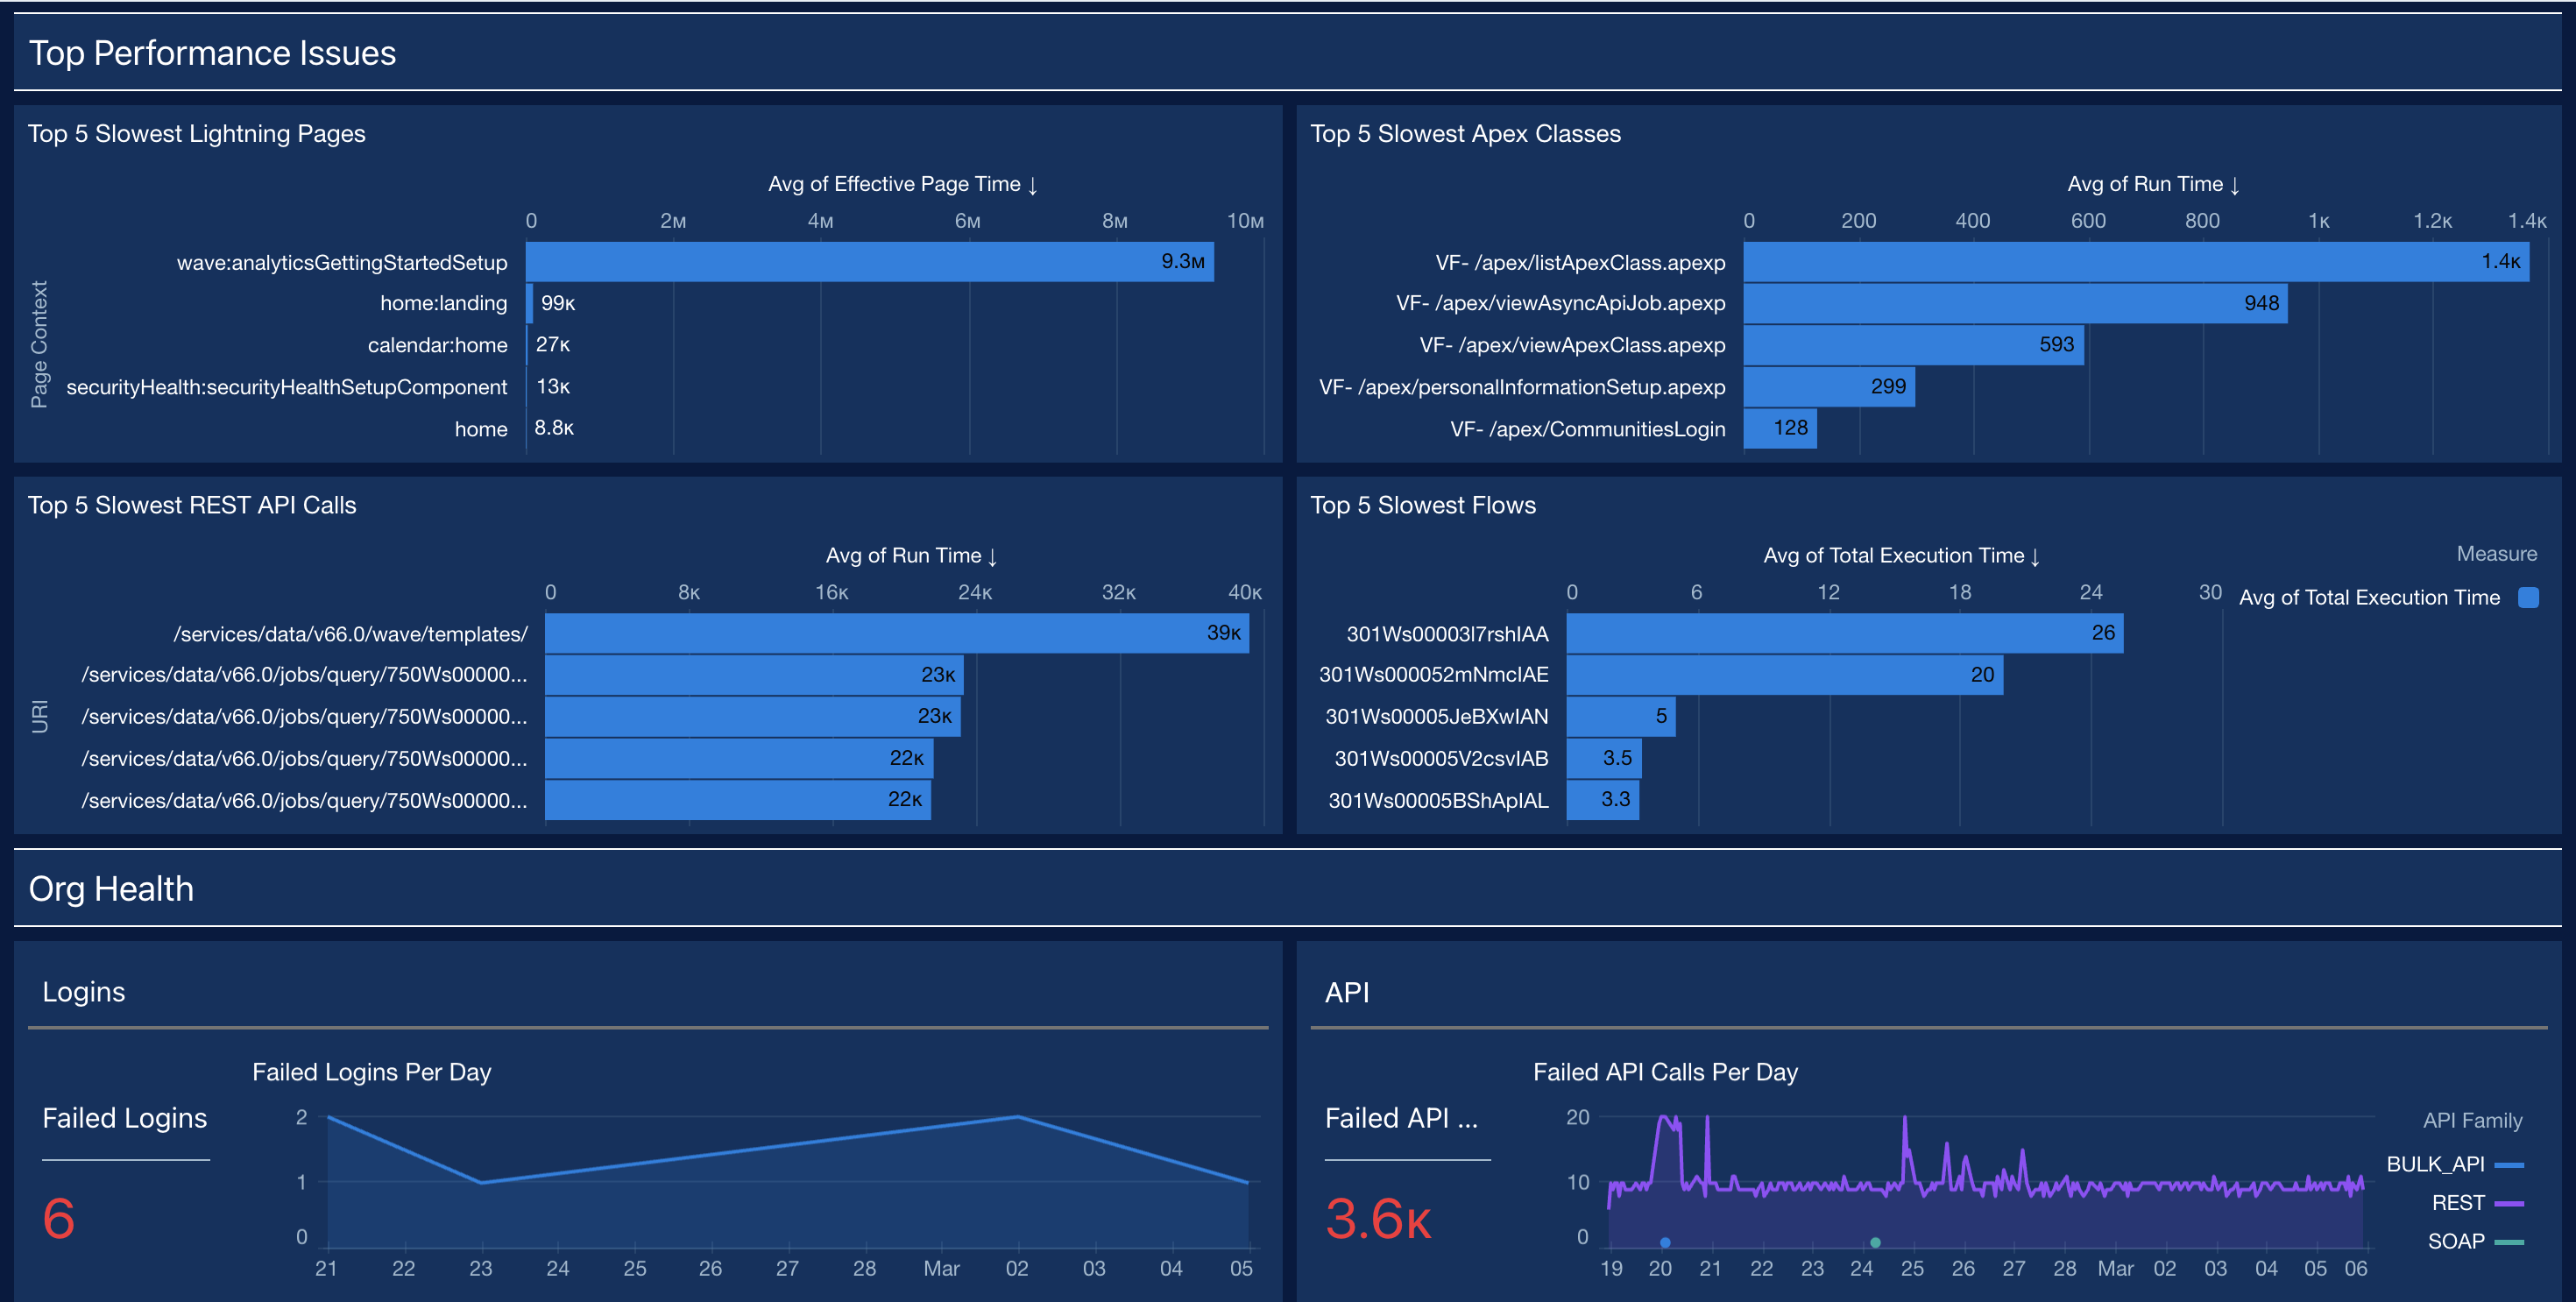
Performance and Health: This dashboard provides a summary of the org's overall
health, tracking errors and slow performance for logins, API calls, Apex code, and Lightning assets.
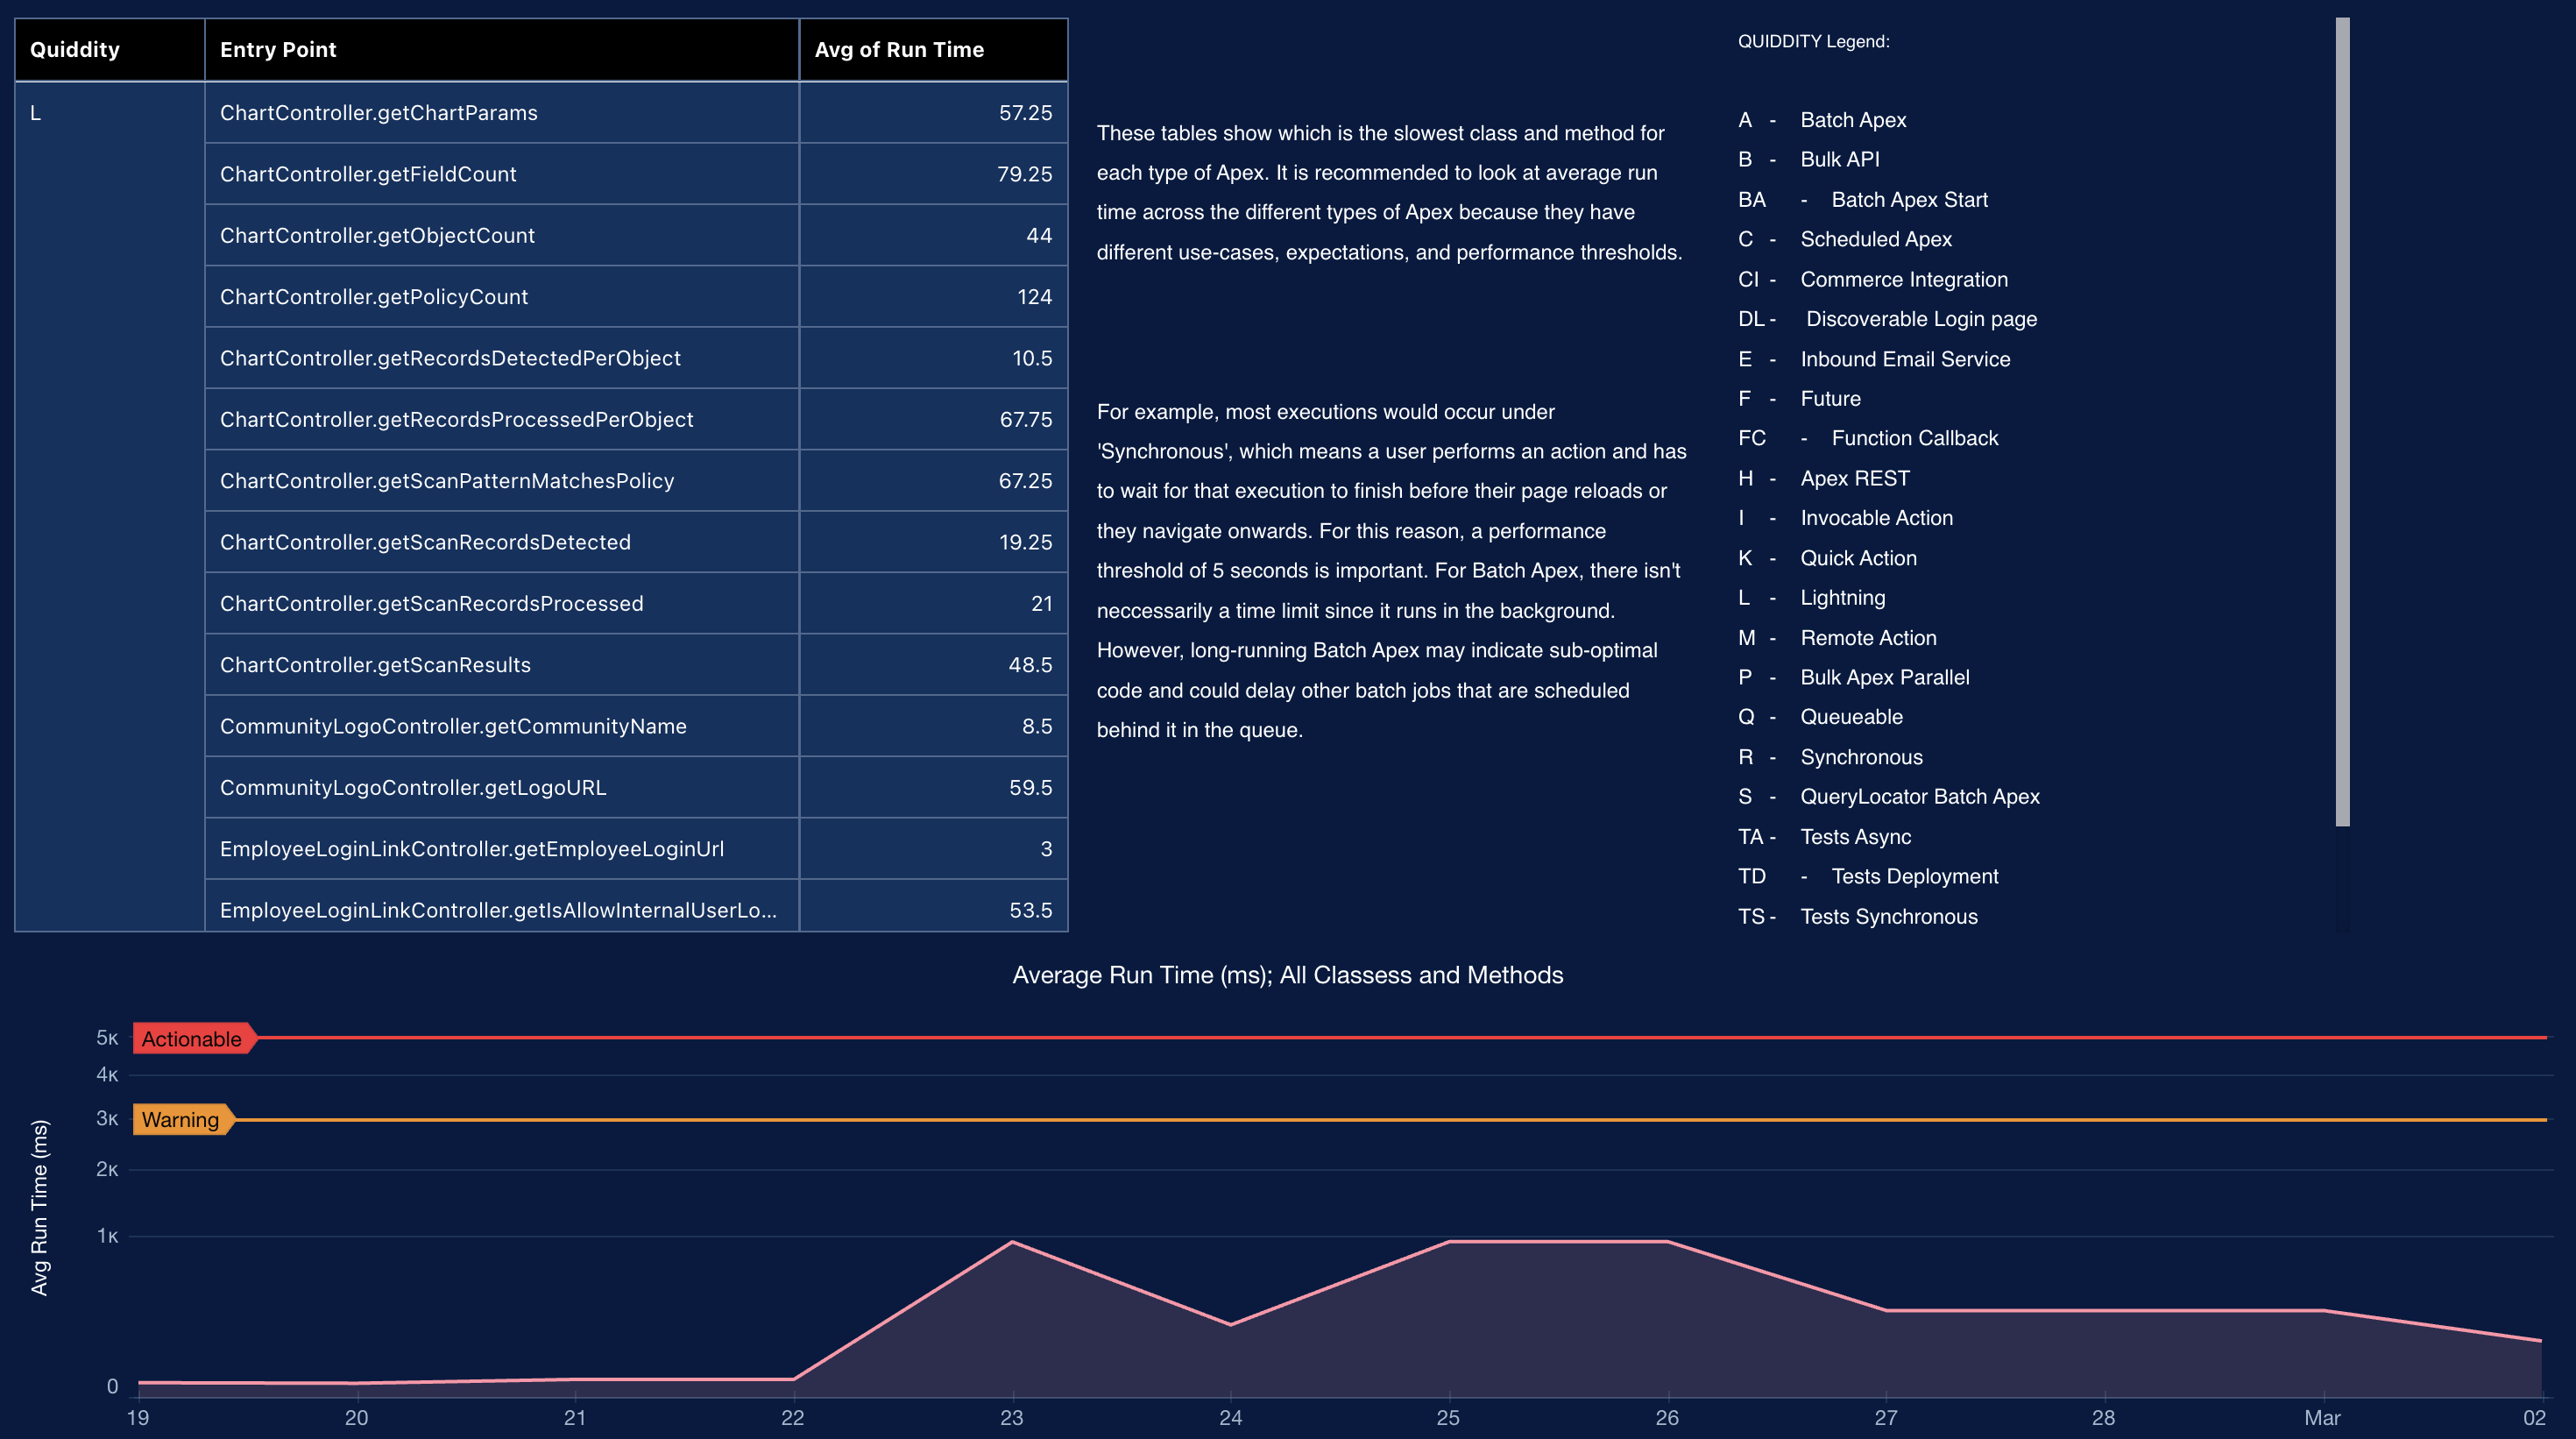
Apex Performance: This dashboard supports dev teams by identifying errors and
optimizing both inefficient custom Apex classes and SOQL queries that may be slowing down
the system.
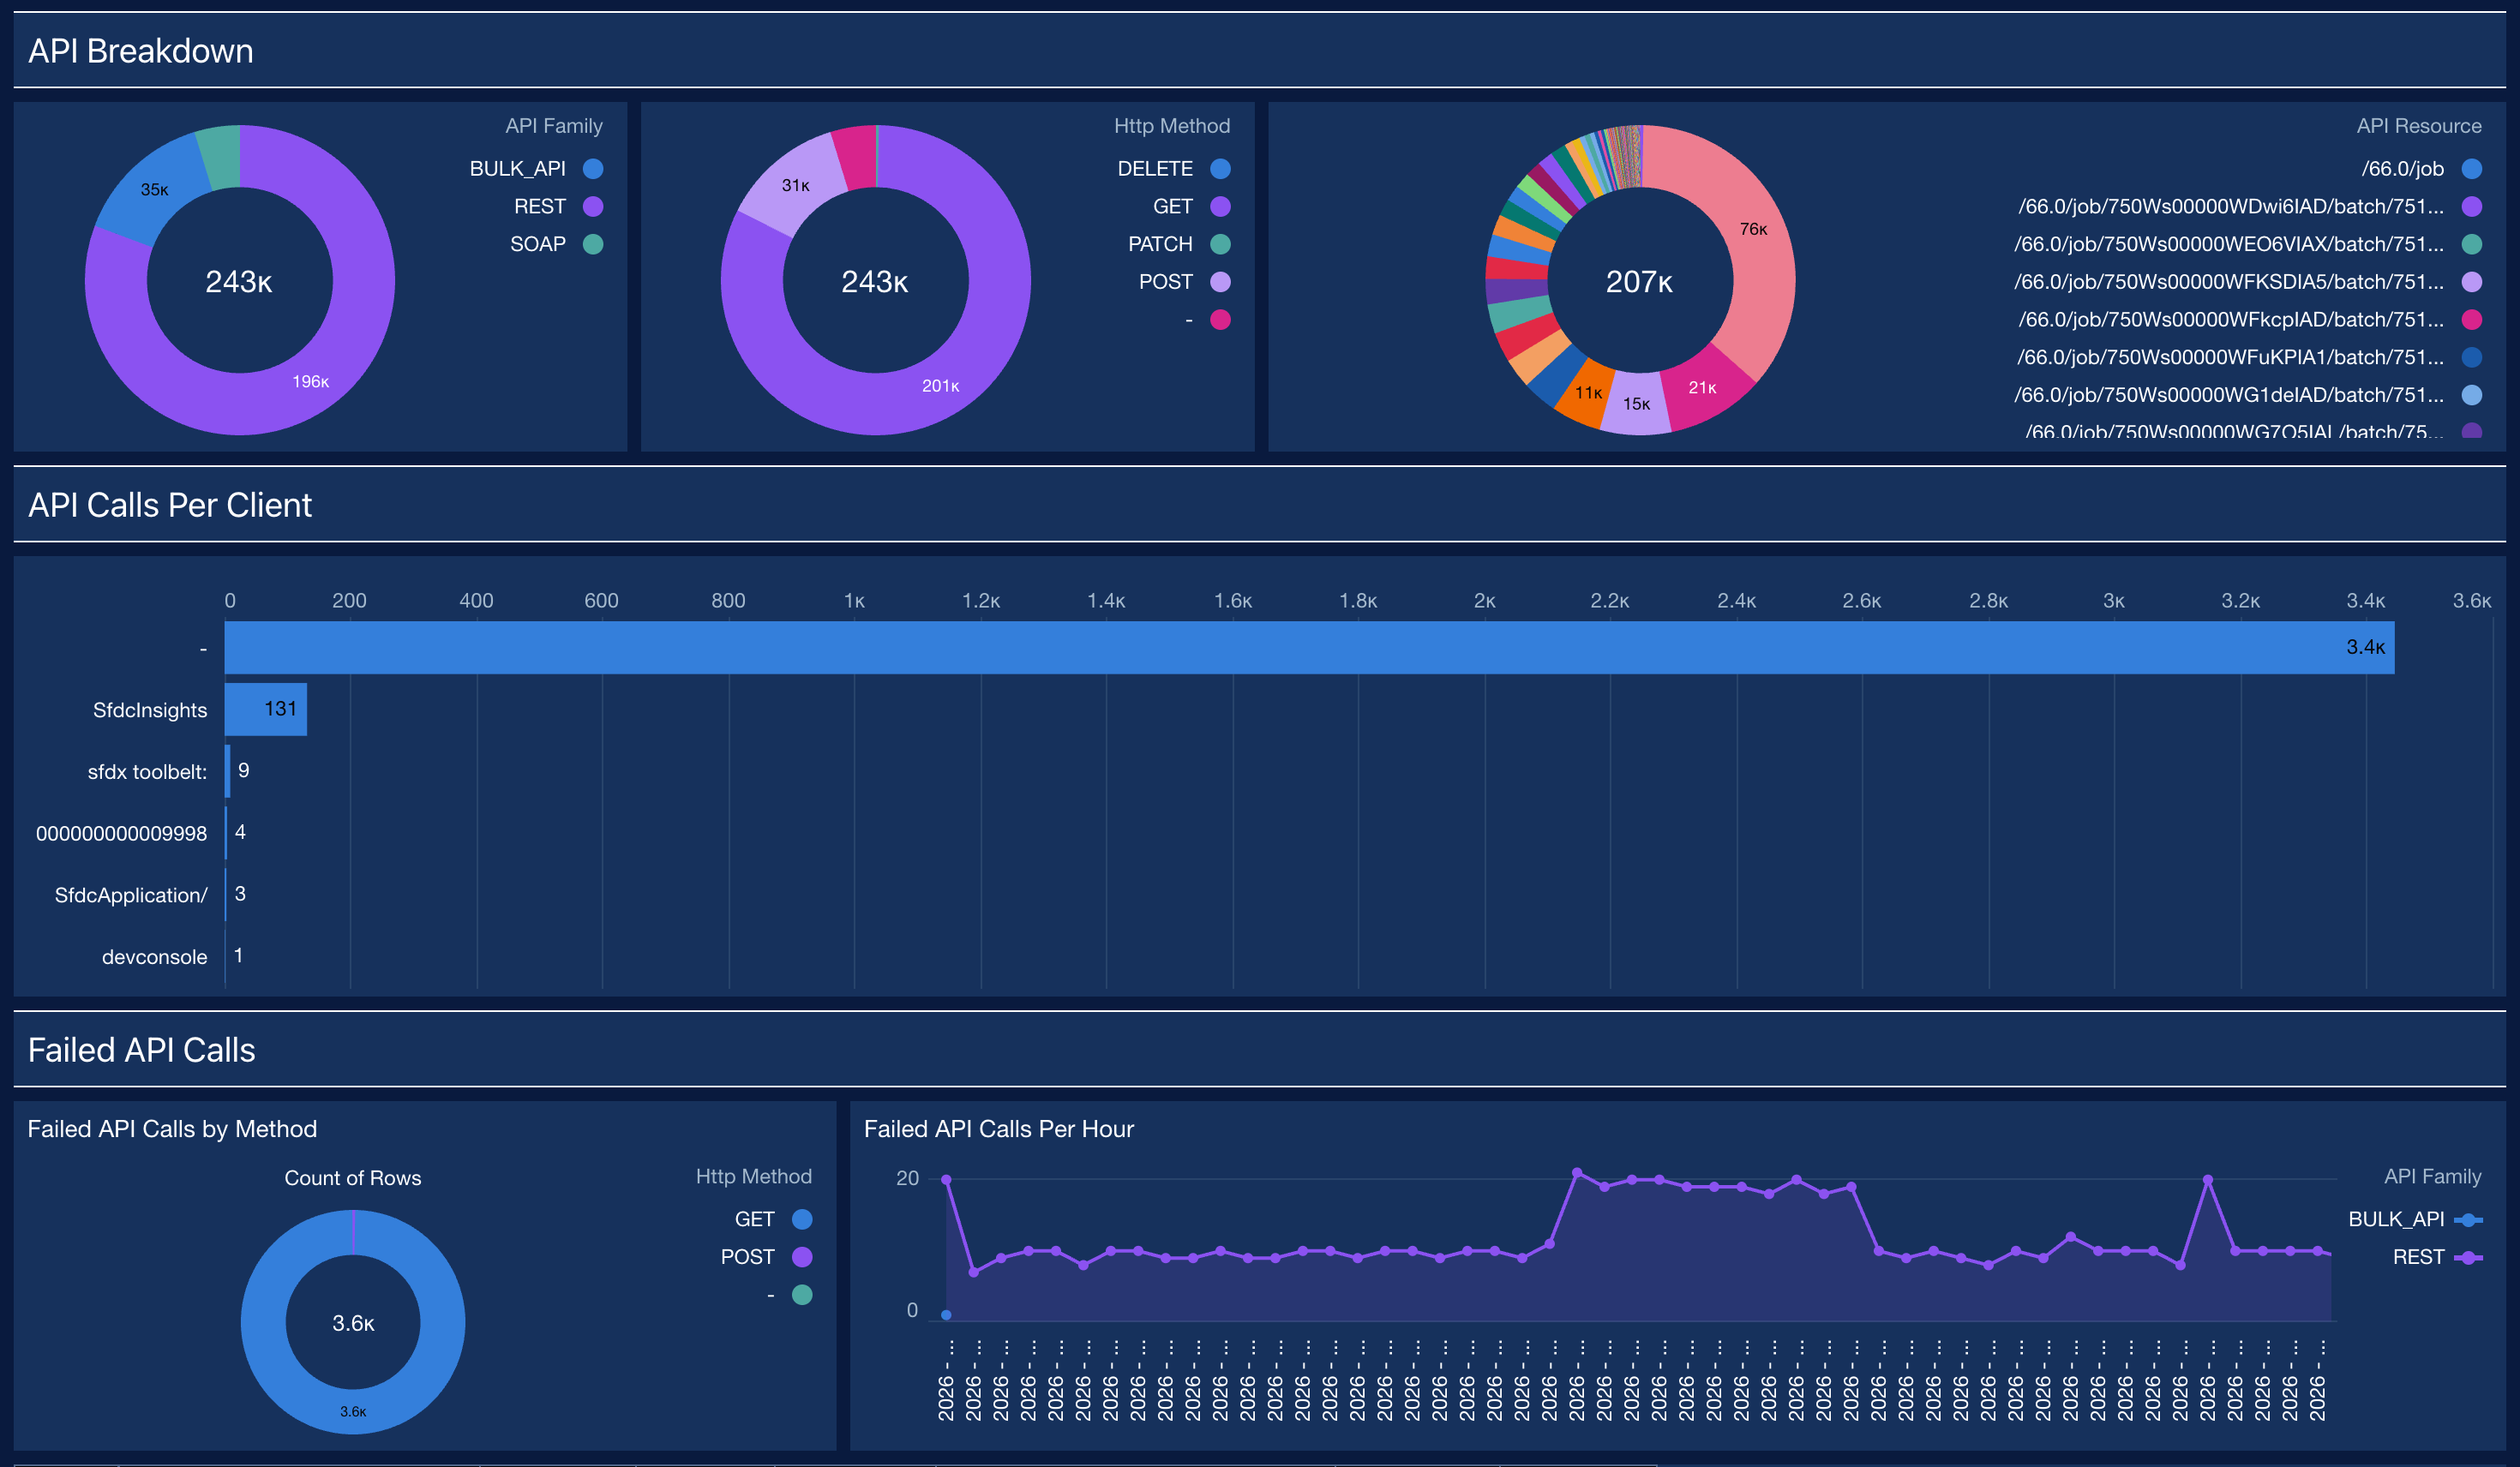
API Summary: This dashboard provides a complete overview of API usage, health, and
performance. This is critical for managing all inbound and outbound integrations.
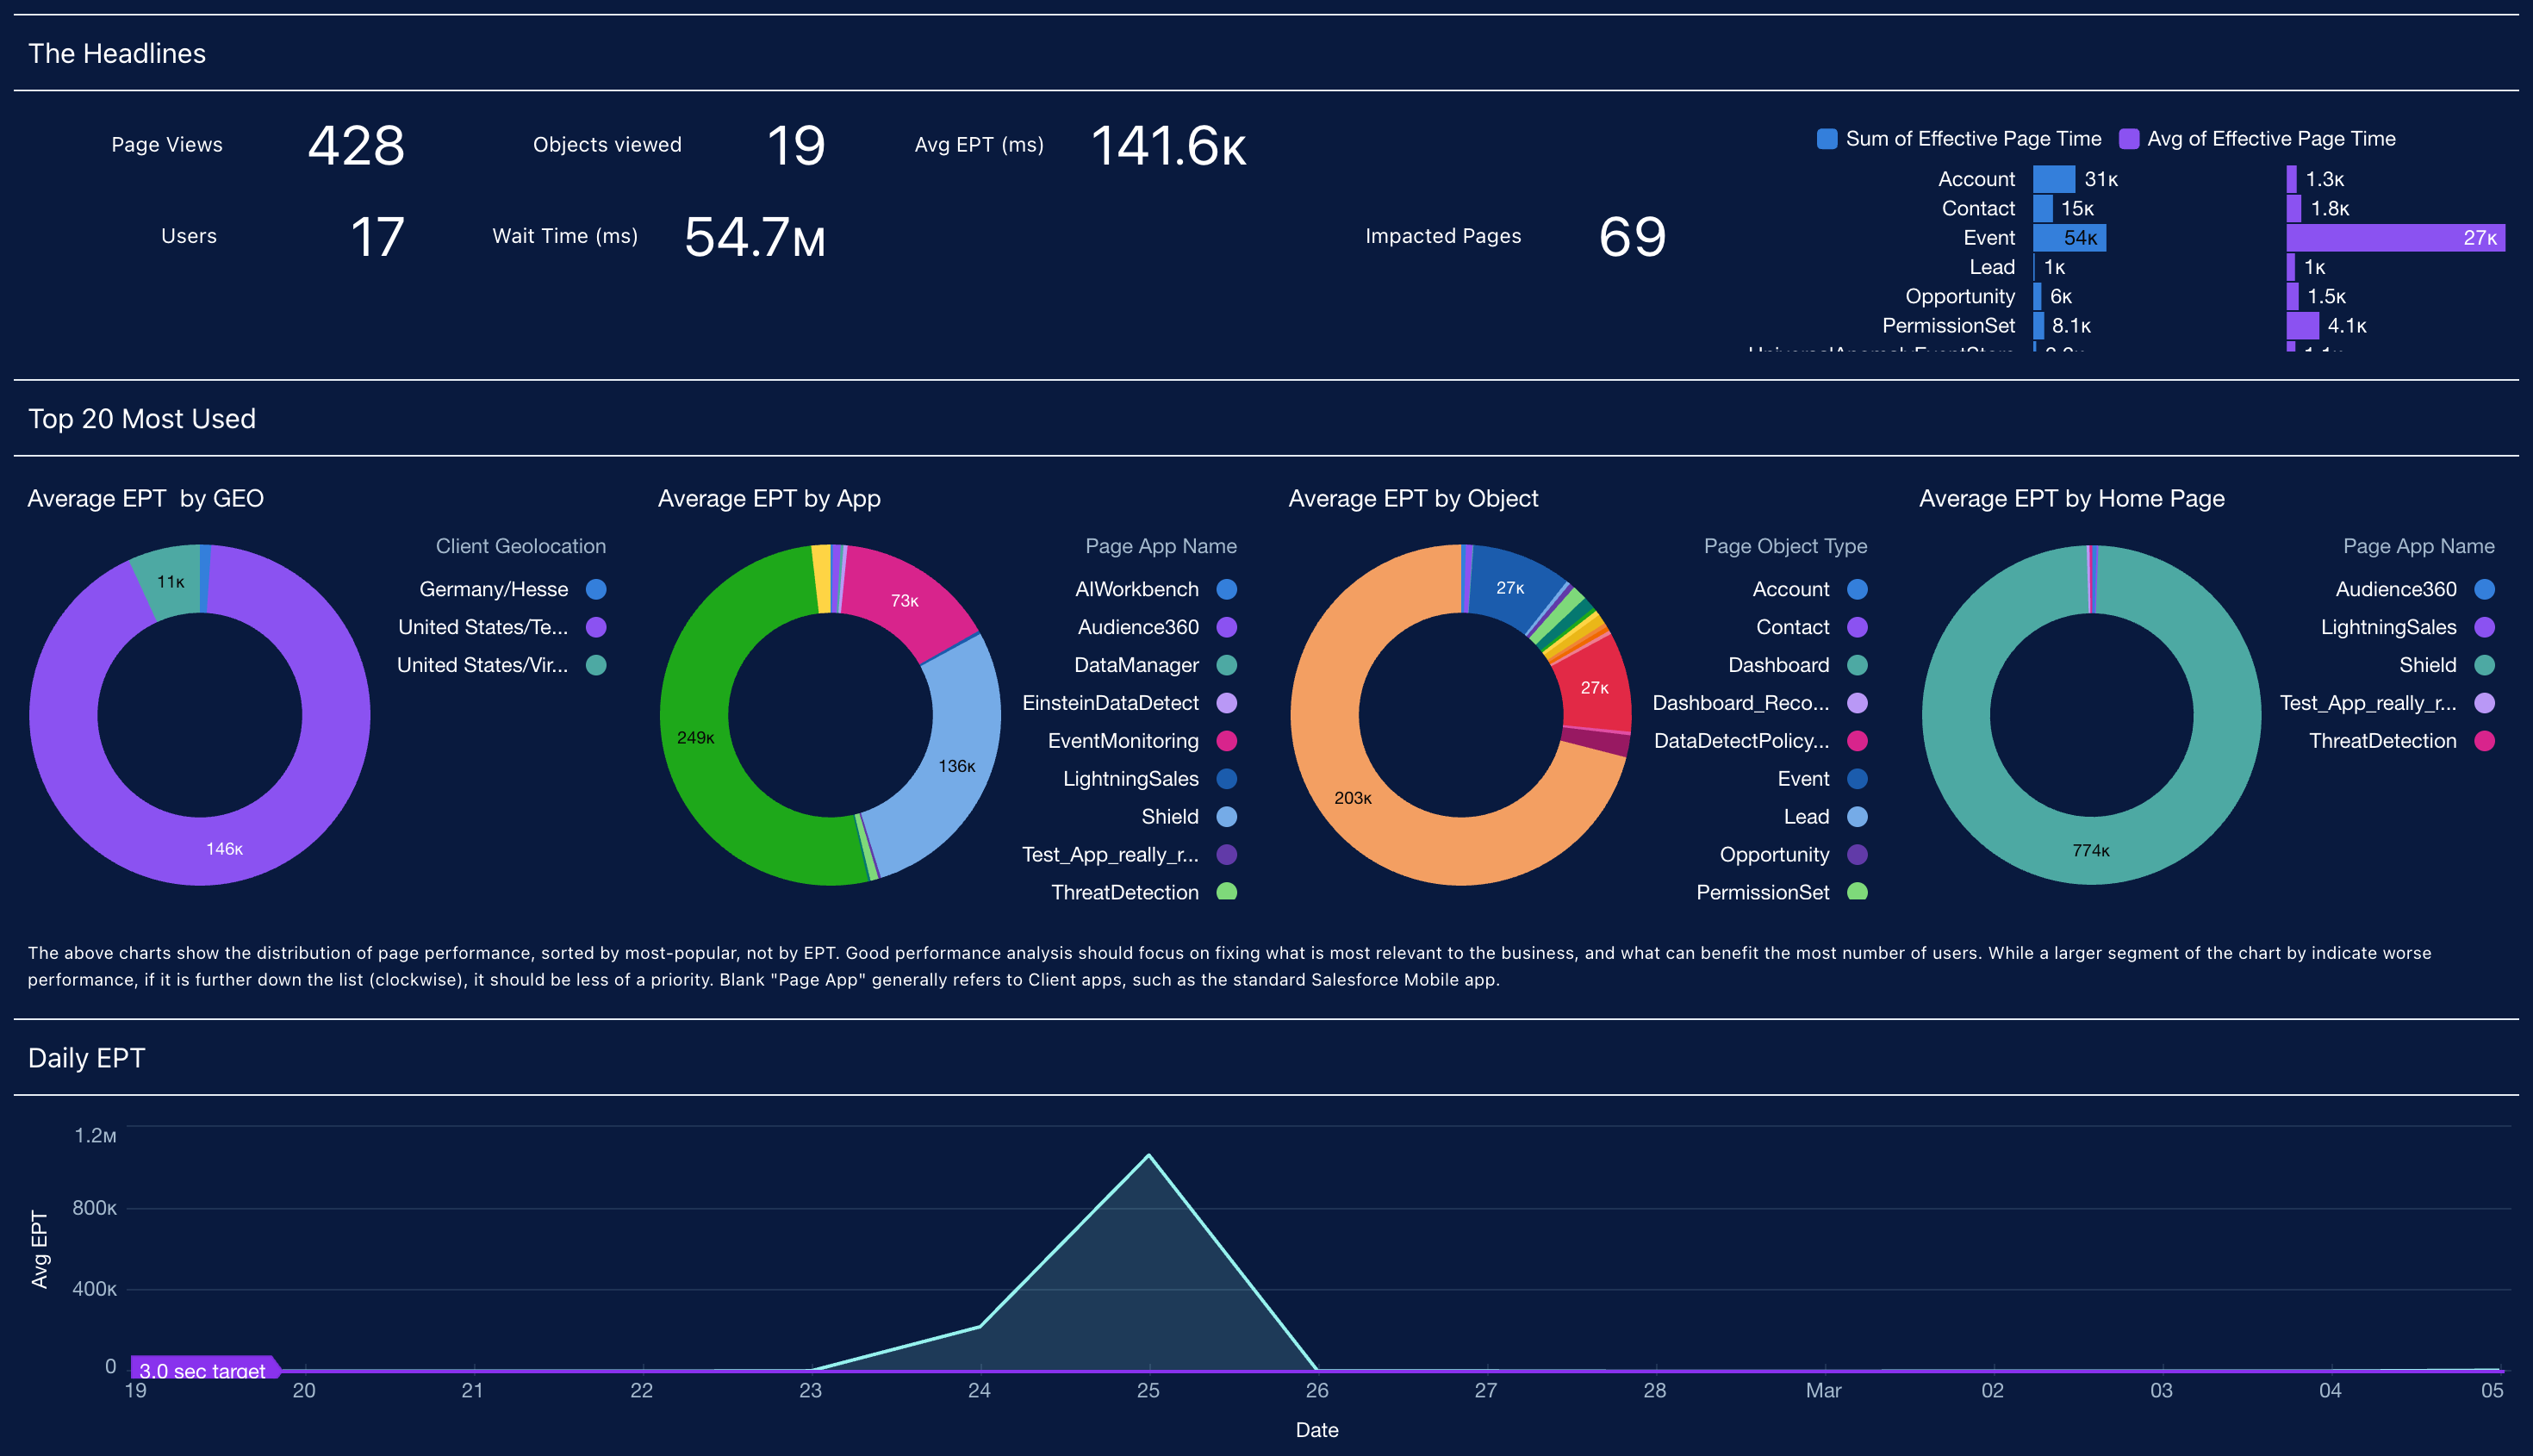
Lightning Performance: This dashboard provides a deep dive into the user
experience, focusing on Lightning Effective Page Time (EPT). It shows the slowest pages and
helps identify the cause.
Did this article solve your issue?
Let us know so we can improve!
Loading
Salesforce Help | Article
Cookie Consent Manager
Cookie Consent Manager
General Information
Required Cookies
Functional Cookies
Advertising Cookies
General Information
We use three kinds of cookies on our websites: required, functional, and advertising. You can choose whether functional and advertising cookies apply. Click on the different cookie categories to find out more about each category and to change the default settings.
Privacy Statement
Required Cookies
Always Active
Required cookies are necessary for basic website functionality. Some examples include: session cookies needed to transmit the website, authentication cookies, and security cookies.
Functional Cookies
Functional cookies enhance functions, performance, and services on the website. Some examples include: cookies used to analyze site traffic, cookies used for market research, and cookies used to display advertising that is not directed to a particular individual.
Advertising Cookies
Advertising cookies track activity across websites in order to understand a viewer’s interests, and direct them specific marketing. Some examples include: cookies used for remarketing, or interest-based advertising.