Review Detailed Metric Data
The metric detail page provides graphical and record-level views of changes, totals, and trends. Use this page for audits, deploying or updating policies, and monitoring usage patterns.
Required Editions
| Available in: Lightning Experience |
| Available in: Enterprise and Unlimited Editions with the Security Center add-on license. |
| Available for free in: Developer Edition |
| User Permissions Needed | |
|---|---|
| To view Security Center pages: | View Security Center Pages |

Note This content relates to Security Center. Read
about Security Insights, Data Classification, and Who Sees What Explorer in Own from Salesforce.
Detail pages include these graphical elements.
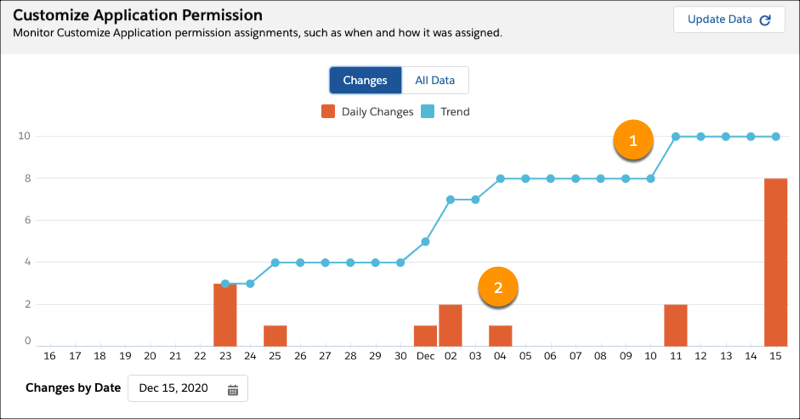
- The trend graph offers an easy overview of the total metric count (1).
- The daily change graph isolates the changes made to a metric on a specific day (2).
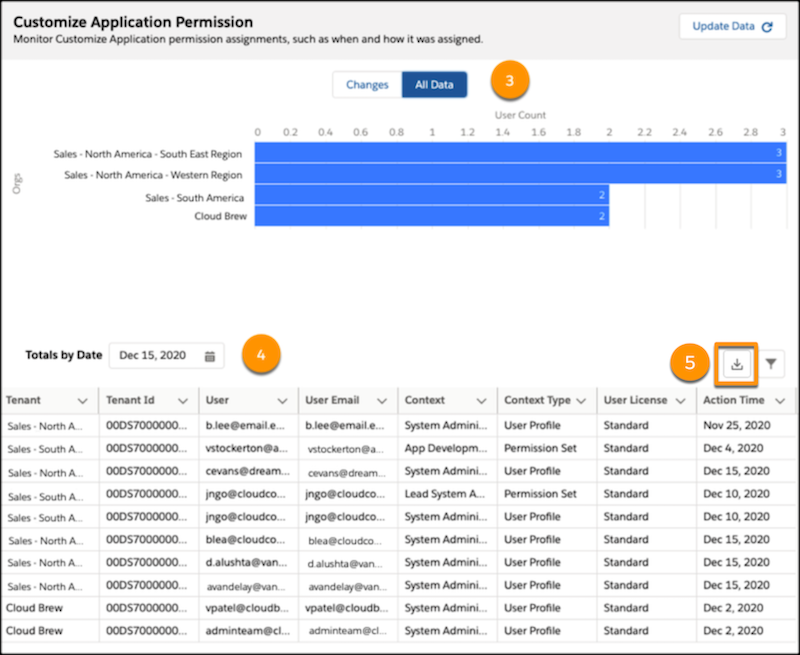
The All Data view shows metric data by tenant (3). Detail pages also include a date range picker and detail record table (4). The detail record table is sortable, helping you organize by date, user, or the context around a particular change. You can also add custom filters to find data for specific tenants and users.
To download your data, click the Download icon (5).

Example Suppose you open the preceding detail view and see a jump in the number of users assigned
the Customize Application permission. Because this permission is powerful, it’s worth looking
into. From the Changes By Date fields, select the days of the increase, and review the detail
table. You can also click All Data to review how many users have the
permission in each connected tenant. Several changes were made to permission sets on December 15,
and some individuals were assigned the permission by the system admin. Use this data to inform
your analysis of your security policies and practices. In this case, talk with the admin for the
applicable tenants for a better understanding of how they apply your data access
policies.
Detail View Considerations
Keep these considerations in mind as you review detail data.
- Even though Security Center initiates its update daily, authentication metrics are recorded only for the previous day. For example, if an update starts at 8 AM GMT on April 23, it captures authentication metrics for April 22.
- On the Changes view, the detail table is visible for dates that record a change.
- The date displayed when you hover over a point in the All Data and Changes charts indicates the day Security Center picked up the change. This date is typically a maximum of 1 day after the change occurs. The date shown in the table below the chart reflects the day that the change actually occurred.
- You can create custom alerts to immediately learn about changes made to security settings. For more information, see Create Alerts for Security Changes.
- Disconnecting or connecting tenants during the update period can cause partial data to load.
- Disruptions in the connection between Security Center and a tenant can lead to partial, incomplete, or missing detail record tables. If the Changes graph shows a change and you don’t see a detail table, the app had a connection disruption during the update process. Graphs and detail record tables update during the next app update.
Did this article solve your issue?
Let us know so we can improve!
