
Quick Start: Event Monitoring
If you're new to Event Monitoring, this quick start guide walks you through the most direct path to get set up. Event Monitoring gives you access to detailed performance, security, and usage data on all of your Salesforce apps.
Required Editions
| Available in both Salesforce Classic (not available in all orgs) and Lightning Experience. |
Enterprise, Performance, Unlimited, and Developer Editions Requires Salesforce Shield or Salesforce Event Monitoring add-on subscriptions. |
| User Permissions Needed | |
|---|---|
| To set up and use Event Monitoring: | Event Monitoring User permission set |
Included in this guide:
- Assign the Event Monitoring Permission
- Turn On Event Monitoring
- Turn On Real-Time Event Monitoring Storage
- Set Up Event Log Object Dashboards
- Query and Visualize Event Log Objects
- Create Transaction Security Policies
- Set Up Threat Detection
- View Threat Detection Details and Provide Feedback
- Optional Resources
- Third-Party Integrations
Assign the Event Monitoring Permission
Set up Event Monitoring with one permission. The Event Monitoring User permission gives you access to event log files (ELFs), event log objects (ELOs), real-time events, and the Threat Detection app.
- From Setup, in the Quick Find box, enter Permission, and then click Permission Sets.
- Click Event Monitoring User | Manage Assignments.
- Select a user, and then click Add Assignments.
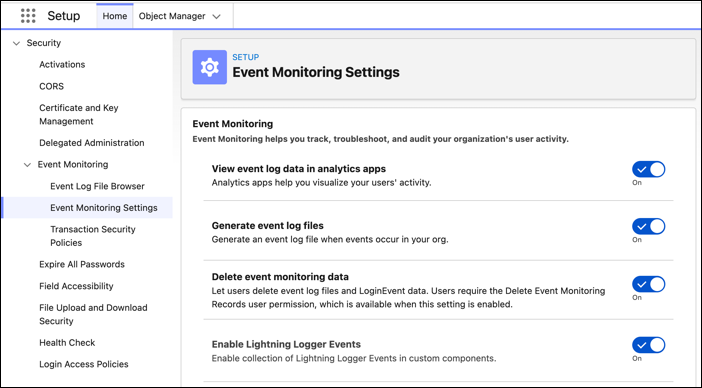
Turn On Event Monitoring
Turn on critical ELF settings.
- From Setup, in the Quick Find box, enter Event Monitoring, and then select Event Monitoring Settings.
-
Turn on:
- View event log data in analytics apps—Shows ELF data in CRM Analytics.
- Generate event log files—Generates over 70 different ELF types. Generate event log files is on by default for Shield & Event Monitoring customers.
-
Retain event log files—Stores ELF data for one year.
 Note If needed, Backup & Recover can retain ELF data for longer than a year.
 - (Optional) Delete event monitoring data—Allows manual deletion of ELF data, which is sometimes required to meet regulatory and privacy requirements such as GDPR.
- (Optional) Enable Lightning Logger—Adds observability to your Lightning web components (LWCs) by using the Custom Component Instrumentation API. Manually instrument your org's LWCs by using the Lightning Logger. Logs generated by the Lightning Logger publish through the Lightning Logger Event Type.
Turn On Real-Time Event Monitoring Storage and Streaming
Real-Time Event Monitoring (RTEM) publishes user events in near real-time. You can store and query RTE data in Salesforce big objects for auditing and reporting purposes.
RTEM events stored in Salesforce don’t count against your data storage limits. Many of the storage events are Salesforce big objects, which are ideal for storing large volumes of data. See Real-Time Event Monitoring Data Storage.
You can subscribe to real-time Events published by Salesforce to monitor activity in your org. See Real-Time Event Monitoring Data Streaming.
- From Setup, in the Quick Find box, enter Event Manager, and then click Event Manager.
- From the dropdown next to an event, click Enable Storage and Enable Streaming.
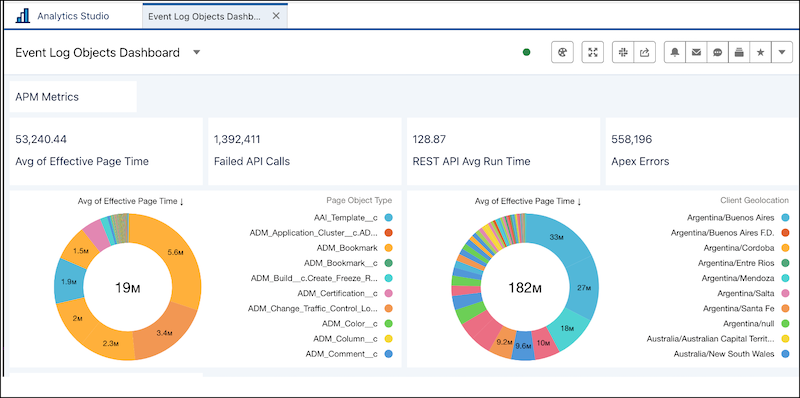
Set Up Event Log Object Analytics
Gain visibility into platform performance, security threats, and user behavior when you transform log data by using event log objects (ELO) analytics. Actionable insights help you proactively identify and resolve latent system bottlenecks and detect security anomalies before they impact the production environment.
Before setting up ELO analytics, confirm you have:
- The Event Monitoring User permission set assigned
- The Event Monitoring Analytics Admin or Event Monitoring Analytics User permission set license assigned
- CRM Analytics enabled
- From the App Launcher, find and select Analytics Studio.
- Click Create, and select App.
- In the Search bar, enter Event Monitoring Event Log Objects Analytics.
- Click the Event Monitoring Event Log Objects Analytics template, and then click Continue.
-
Name your app and click Create.
Query and Visualize Event Log Objects
Access and analyze visual log data quickly for earlier detection of security and performance incidents.
- From Setup, in the Quick Find box, enter Analytics Studio, and select Analytics Studio.
- To create a dashboard, click Create and then, from the dropdown list, select Dashboard.
- Drag the Chart option to your dashboard.
- To select a data source, click the new chart.
- In the data source window, go to the Salesforce Object tab.
- To see all event log objects, search for event log.
- Select the event log object data you want to visualize. See Visualize Data With Charts.
-
You can visualize your data in a variety of chart types using Salesforce Direct. Limit
the number of panels on your dashboard to avoid any timeouts. See Salesforce Direct Data Queries.
Create Transaction Security Policies
Use the Transaction Security Condition Builder to create transaction security policies (TSPs) that can notify you or block an action when a user takes a potentially malicious or risky action in Salesforce.
For information on included TSPs, examples, and using Apex for advanced use cases, see Essential Transaction Security Policies to Enhance Your Security Posture.
This example creates a policy that notifies you when someone downloads a report that contains more than 10,000 records.
- From Setup, in the Quick Find box, enter Transaction Security, and then select Transaction Security Policies.
- Click New, and then select Condition Builder.
- Click Next.
-
Select or enter:
- Event: Report Event
- Condition Logic: All Conditions Are Met (AND)
- Condition: Operation Equals ReportExported
- Condition: Rows Processed Greater than 10,000
- Click Next.
-
Select or enter:
- Action: None
- Notification: Email Notification
- Recipient: Select yourself
- Name: Enter a name
- Status: Enabled
- Click Finish.
Set Up Threat Detection
Before you can view the Threat Detection events in Salesforce and provide feedback, you must make the app visible to users. You also specify which of the tabs are visible to different user profiles.
Confirm you have the Event Monitoring User permission set which includes View Threat Detection Events.
- Use Event Manager to enable streaming and storage for the Threat Detection events: ReportAnomalyEvent, SessionHijackingEvent, GuestUserAnomalyEvent, LoginAnomalyEvent and CredentialStuffingEvent.Create a permission set that’s associated with the Salesforce license.
-
Edit the Tab Settings of each user profile that uses the Threat Detection app and specify
the visibility of the tabs. The tabs are named Report Anomaly Event Store, Session Hijacking
Event Store, Credential Stuffing Event Store, and Threat Detection Feedback.
For example, system administrators usually access everything in the UI, so set the visibility of all tabs to Default On for the System Administrator profile. If you created a Threat Detection Administrator profile, set the same visibility. If you don’t want standard users to view feedback, set the visibility of Threat Detection Feedback for the Standard User profile to Tab Hidden.
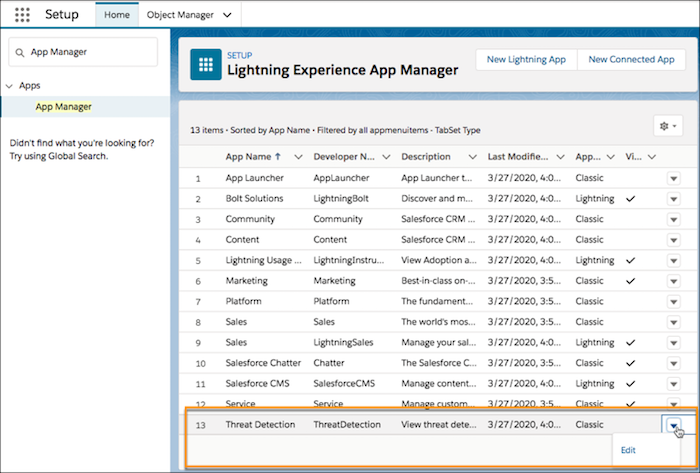
- From Setup, in the Quick Find box, enter App Manager.
-
Edit the Threat Detection app by selecting Edit in the dropdown to
the right of the app.
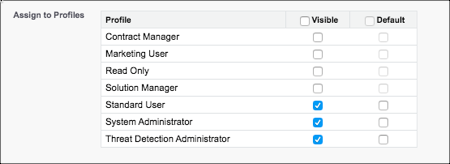
-
In the Assign to Profiles section, select the profiles for which the Threat Detection app
is visible.
- Save your changes.
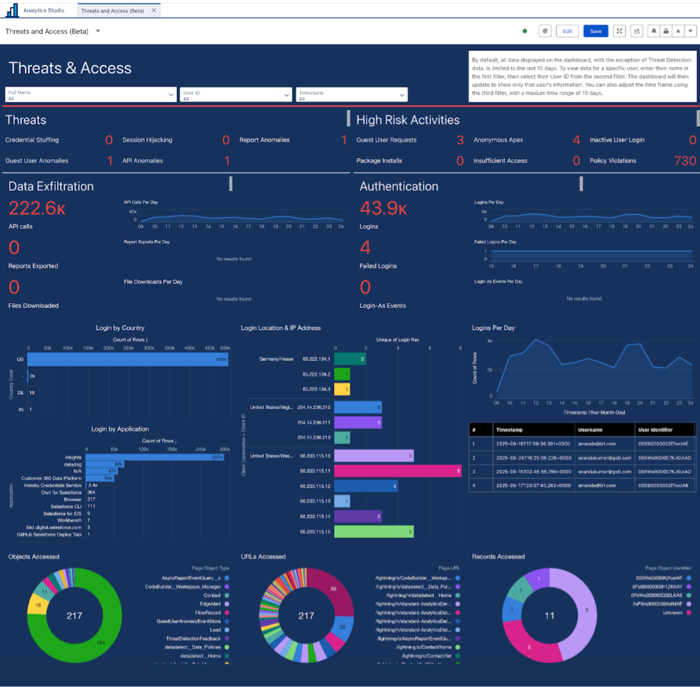
View Threat Detection Details and Provide Feedback
Threat Detection uses statistical and machine learning methods to detect threats to your Salesforce org, and captures that data in real-time event objects. View recent or all Threat Detection events using the Threat Detection app in the Salesforce UI.
- From the App Launcher, find and select Threat Detection.
- Click the tabs for list views of recent or all events stored in the Threat Detection objects.
-
To view event details, click the event.
See Threat Detection for information on how to read threat event details.
- To view feedback associated with an event, click Related .
After you review a threat event, click Feedback. Your feedback helps Salesforce train the machine learning and AI models to classify threat severity more accurately.
Optional Resources
Now that you have access to Event Monitoring features, learn more about what else you can do.
| Resource | Description | Link |
|---|---|---|
| Learning maps | Get a consolidated view of Event Monitoring-related documentation and Trailhead content . | See the Monitor Events tab of the Check in on Your Data (And Who’s Using It) Learning Map. |
| Supported event types | View the schemas for the different Events. | |
| Salesforce Help | Review in-depth content and options for Event Monitoring. | Event Monitoring |
| Trailhead | Practice using Event Monitoring, ELFs, and event data in Trailhead. | |
| Open source dashboards | Take advantage of community-supported Event Monitoring dashboards after the Event Monitoring Analytics app is set up. |
|
Third-Party Integrations
Most security information and event management (SIEM) and observability solutions can import Event Monitoring data through our APIs. These partners and SIEM solutions support connections that make it easy to import Event Monitoring data.
| Partner Name | ELF Connector | RTEM Connector | Link / Reference |
|---|---|---|---|
| Appomni | No | Yes | App Exchange Listing |
| AWS App Fabric | Yes | No | AppFabric |
| Better Cloud | No | Yes | Blog Post |
| Coralogix | Yes | Yes | Documentation |
| Datadog | Yes | Yes | Blog Post |
| Dynatrace | Yes | Yes | Salesforce Streaming API |
| Enforce | Yes | Yes | Enforce + EM App Exchange Listing |
| Exabeam | No | No | Not Available. Possible through custom implementation. |
| Fair Warning | Yes | Yes | App Exchange Listing |
| IBM - Qradar | Yes | No | Qradar Docs |
| Microsoft Sentinel | Yes | No | Support for ELF |
| New Relic | Yes | Yes | New Relic PDF |
| Rapid7 | No | No | Rapid 7 |
| Securonix | Yes | No | Securonix |
| Splunk | Yes | Yes | ELF Add-On; Splunk Add-on for Salesforce Streaming API |
| Sumo Logic | Yes | No | Sumo Logic |
| Varonis | Yes | No | Not Available |
| Wazuh SIEM/XDR via Elastic ELK | Yes | Yes | Wazuh can use Elastic ELK filebeat connector to ingest EM ELF or RTEM data. |