Выбрать организацию
Proactive Monitoring on Salesforce Help
Дата публикации: Jan 26, 2026
Описание

• Eligibility Requirements • How to Access • Key Features • FAQs and Known Issues Proactive Monitoring on Salesforce Help Overview Proactive Monitoring helps predict and prevent issues with 24/7 monitoring and early warnings, allowing customers to keep their business operations running smoothly. The Proactive Monitoring tab on Salesforce Help provides Signature Success Plan customers with on-demand analysis of performance metric trends and a view into alert configuration. With Proactive Monitoring on Salesforce Help, customers can:
Watch the demo video to learn more about Proactive Monitoring on Help. Eligibility Requirements Proactive Monitoring on Salesforce Help is available to Signature Success Plan customers with Sales, Service, Experience Cloud, Platform, Marketing Cloud Account Engagement (MCAE), or Marketing Cloud Intelligence (MCI). Users must meet the eligibility requirements below:
How to Access Once a customer has confirmed they meet the eligibility requirements, Proactive Monitoring on Salesforce Help can be accessed through the navigation tab.
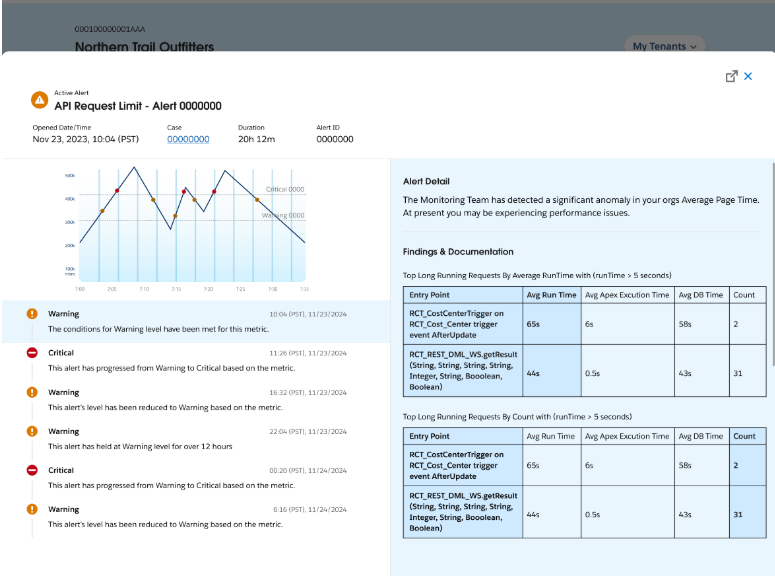
Key Features of Proactive Monitoring on Salesforce Help Visualizing Alerts When a user receives an alert via a Proactive Monitoring email, they can select the Analyze Trends button to launch Proactive Monitoring on Salesforce Help. Once authenticated, the tenant, metrics, and time range for the relevant alert will be auto-populated on the dashboard on the Metrics tab within Proactive Monitoring on Salesforce Help. Active alerts and recent alerts from the past 7 days can also be accessed and auto-populated from the Active / Recent Alerts dropdown on the Metrics tab. When an active alert is populated on the dashboard, an icon will appear on the trendline at the point the alert was fired, indicating the highest severity of the alert to date. Past alerts created in the last 30 days are also visible on the trendline depending on the time range selected. 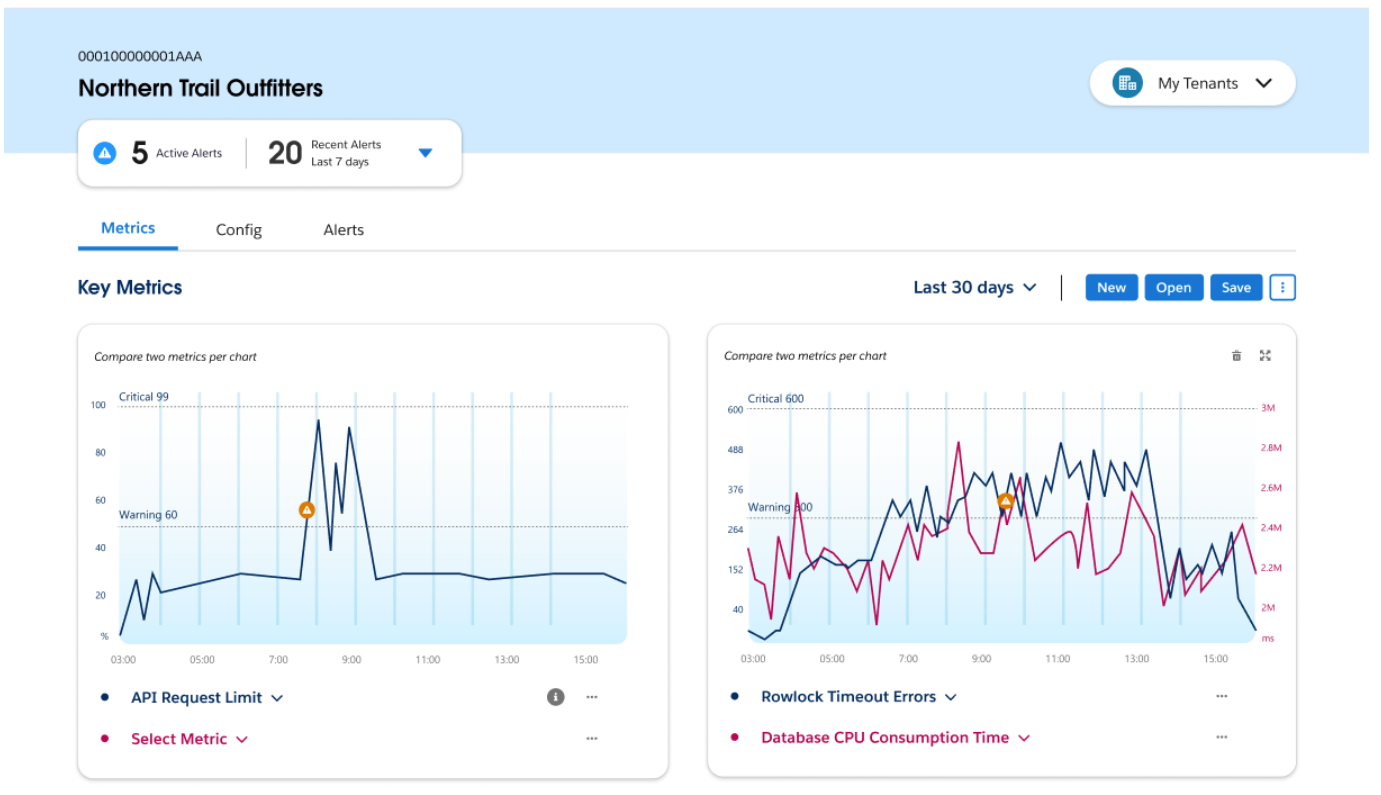 Reviewing Alert Details Customers can review diagnostic information to understand why an alert was fired and potential causes of the issue. Select the alert icon on the trendline for a given alert, which will launch a modal window containing the following details:
 Configuring Dashboard Views Once logged in, a customer can view the Metrics page to analyze and correlate implementation metric trends for their tenants and review alert details. There are multiple features to visualize metrics and monitor implementation health:
Saving and Sharing Dashboard Views Dashboard views can be labeled, saved, and shared with team members to encourage continuous review of key metrics even outside of active alerts. In the upper right of the Metrics tab, a customer can start a new dashboard, open an existing dashboard, or save the current dashboard. Selecting the ellipsis will show additional dashboard options, including sharing a link to the current dashboard configuration with others who have the same access privileges as the given tenant. Reviewing Proactive Monitoring Configuration Details From the Configuration Details tab, customers can view detailed information related to the Proactive Monitoring configuration for each of their tenants to better understand which alerts are active and the alert criteria. All metrics across the Performance, Limits, and Errors categories are listed. The Threshold columns list the threshold criteria that have been met for an alert to fire. The Duration columns list the duration of time in minutes that a metric must hold above a threshold for the alert to fire. Some alerts are based on anomalies from a trailing 30-day baseline rather than a threshold and duration. These are marked as anomaly-based Smart Alerts. Tooltips next to each metric provide concise descriptions. To toggle between enabled alerts versus all available alerts for the selected tenant, customers can select Show only configured alert metrics. Manage and Update Alert Configurations
Under the Configuration tab, customers can manage and update alert configurations:
Please note: in order to modify thresholds you will need to be a Primary Designated Contact. For more details on best practices, see the related article: ProM on Help: Knowing when & how to modify your alert configurations. 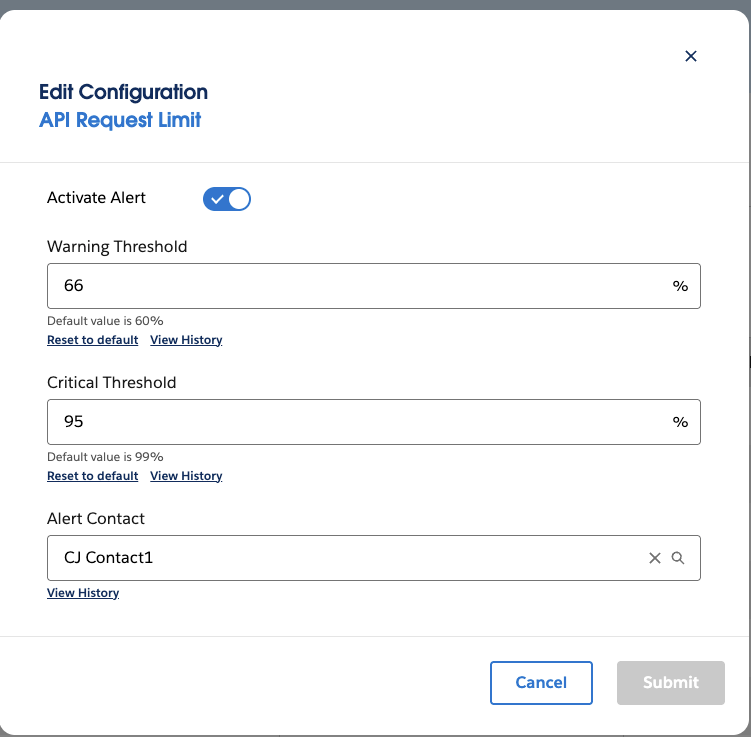 Reviewing Alert History
Customers can view the last 30 days of Proactive Monitoring alerts from the Alerts tab. Alerts that are currently active appear in the upper table, while alerts that have been cleared are below. Cleared alerts can be filtered by level - Warning, Critical, or Exhausted - or by metric type. From the ellipsis in each row, a user can select “View Alert Detail” to open a modal window containing the content of a specific alert, or “Analyze Trends” to load the relevant trendline from the 7 days surrounding that alert. 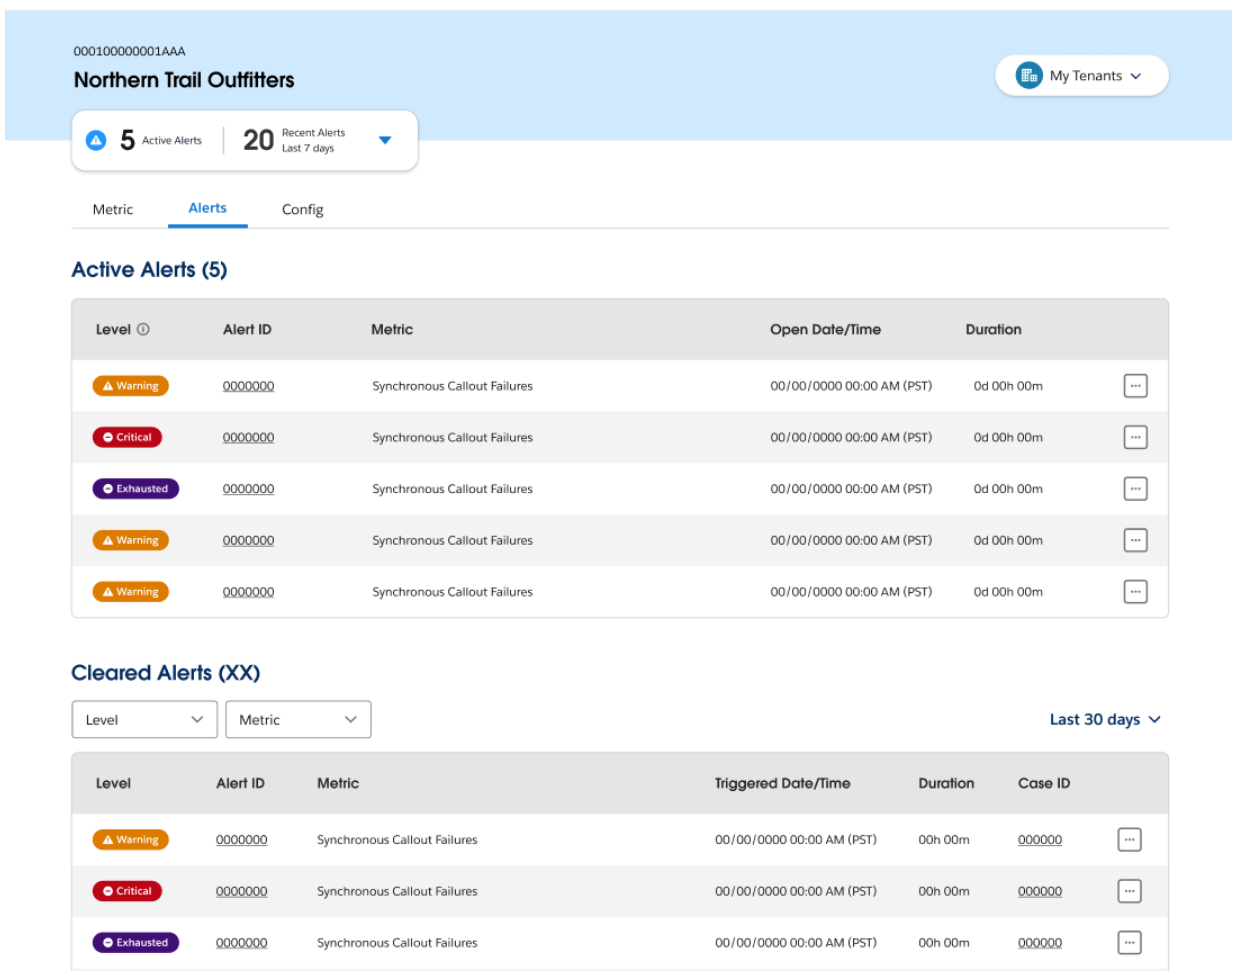 FAQs and Known Issues Which users have access to Proactive Monitoring on Salesforce Help? Designated Contacts, Primary Designated Contacts, and admins will be able to access Proactive Monitoring on Salesforce Help. Primary Designated Contacts can provision additional users as Designated Contacts to enable access to the Proactive Monitoring on Salesforce Help. I started a new session in Proactive Monitoring on Salesforce Help and trendlines are not loading correctly. What should I do? If there is an issue with content loading, try clearing the cache and cookies on the browser and refresh the window (re-authentication will be required). If the issue persists, a customer can contact their Customer Success Manager before opening a support case for troubleshooting. What is the maximum duration of time that metrics and alert data are available? Metrics and alert data are available for the past 30 days. When visualizing Proactive Monitoring metric trends on Salesforce Help, why is the metric threshold only visible as a single line with overlapping text? Some customers have Warning and Critical thresholds set to the same value and only change the duration (in which the metric value must be sustained in order to alert). This results in the Critical and Warning text overlapping since they are set on the same line. Why did I receive an alert that is not visible on Proactive Monitoring on Salesforce Help? Proactive Monitoring on Salesforce Help is only available for Core (Sales, Service, Experience Cloud, and Platform), Marketing Cloud Account Engagement (MCAE), and Marketing Cloud Intelligence (MCI) at the moment. Please be on the lookout for updates regarding future cloud expansion for the portal experience. Why aren’t threshold values for some metrics visible when viewing Proactive Monitoring metrics trends? Some Proactive Monitoring alerts (such as Database CPU Consumption Time, Org Average Page Time, and Experience Page Time) use machine learning and create alerts based on detected anomalies in the metric trend, and therefore do not rely on threshold configuration. These metrics are clearly defined within Proactive Monitoring on Salesforce Help. Why doesn’t an alert appearing on the graph match a corresponding spike or drop? Why doesn’t a spike or drop on the trendline match an alert? For most Proactive Monitoring alerts, the visualization shown on the trendline should clearly depict why an alert was fired. If that does not seem to be the case, there could be a few reasons: Granularity needs to be adjusted. To optimize performance, Proactive Monitoring on Salesforce Help downsamples data based on the time range depicted. Customers might need to adjust the time range to zoom in further for the right visualization to appear. Duration criteria are not met. Most Proactive Monitoring alerts have both threshold and duration criteria, meaning that a metric must exceed a given threshold and be sustained at that level or higher for a given duration to trigger an alert to fire. Brief spikes may not trigger an alert to fire. Customers should review the duration configuration for that alert type against the visualization they see in Proactive Monitoring on Salesforce Help. Limit-based alerts consider consumption. For limit-based alerts, the alerting logic considers the current limit usage against the configured threshold. However, a predictive approach factors in the rate of consumption to determine the likelihood that the limit will be exceeded. This allows alerts to be fired and customers to act before the limit is reached. Customers should review the Alert Details section in a limit-based alert to better understand why the alert may have been triggered. |
Номер статьи базы знаний
002113876
Эта статья решила вашу проблему?
Оставьте свой отзыв, чтобы мы могли стать лучше!