
You are here:
Review the CRM Analytics Lead Scoring Dashboard
The included CRM Analytics Lead Scoring dashboard provides insights into which lead characteristics result in the most conversions. See how well lead scores correlate to conversion rates, monitor the average lead score of each lead source, and more.
Required Editions
| User Permissions Needed | |
|---|---|
| To view the CRM Analytics Lead Scoring app and dashboard: | Use Einstein Lead Scoring AND Use CRM Analytics Templated Apps AND View All Records on leads |
| To create custom CRM Analytics apps using the Einstein Lead Scoring app template: | Use Einstein Lead Scoring AND Manage CRM Analytics Templated Apps AND View All Records on leads |
To open the CRM Analytics Lead Scoring dashboard, click the Analytics tab, and then find the Einstein Lead Scoring app.
Your Salesforce admin can tell Einstein to score segments of your leads separately. To see data for a specific lead segment, choose it from the Segment menu.
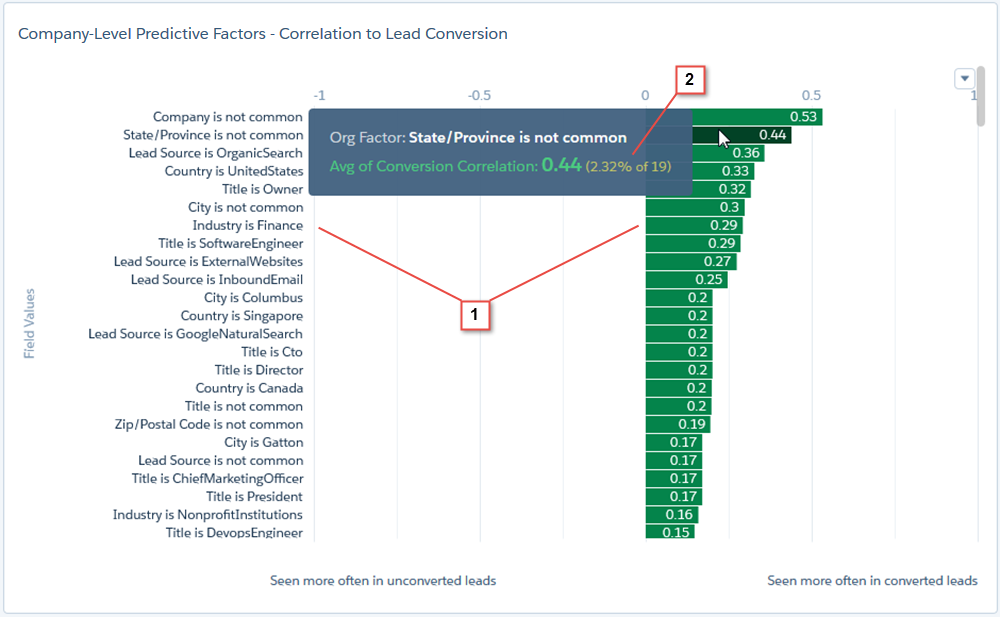
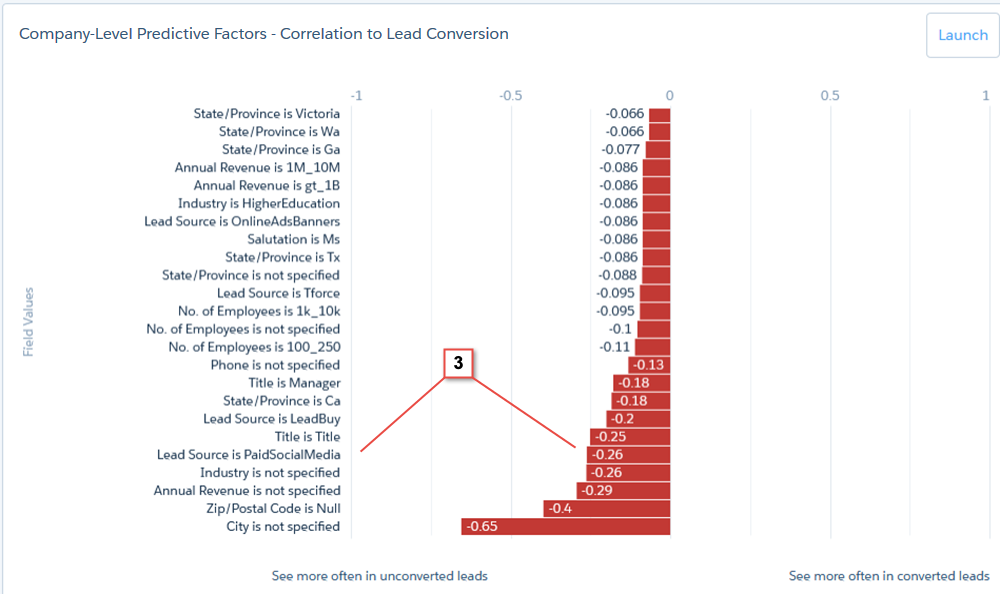
The Company-Level Predictive Factors chart shows which lead field values are seen more often in converted leads (1), and unconverted leads (3).
To view the percentage of leads that have a specific field value, hover over a bar on the chart (2).
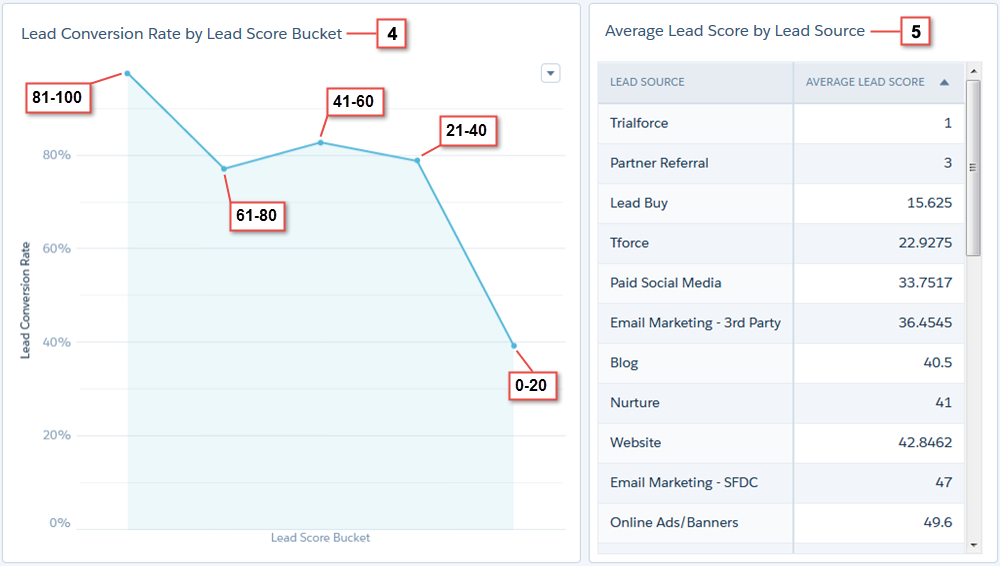
The Lead Conversion Rate chart (4) shows the conversion rate for each slice of lead scores: 0–20, 21–40, 41–60, 61–80, and 81–100. The Average Lead Score table (5) shows the average scores for each lead source.
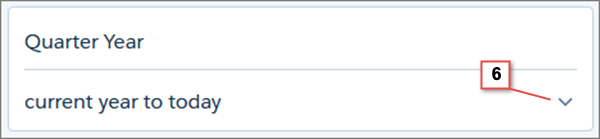
To view lead statistics for a specific time period, select a start and end time at the top of the dashboard (6).
The dashboard also displays more statistics for the selected time period.
- Total number of leads scored
- Number of leads scored between 81–100
- Conversion rate for leads scored between 81–100
- Your overall conversion rate
You can create custom CRM Analytics apps for your users based on the Einstein Lead Scoring app.
- From the App Launcher, find and open Analytics.
- Click Create and then click App.
- Choose the Einstein Lead Scoring Analytics template.

Sometimes, the lead conversion rate for the 0 through 20 bucket incorrectly appears higher than the 81 through 100 bucket. The overall lead conversion rate can also appear significantly higher than the 81 through 100 bucket. This effect is because of how CRM Analytics treats null values in some fields. To resolve these issues, contact Salesforce Customer Support.
