
Get Insights with Agent Analytics Dashboards
Use the data from your Service Agent Analytics and Employee Agent Analytics dashboards to understand agent performance, and determine whether you want to adjust subagents and actions to improve user satisfaction.
Required Editions
| Required Editions |
|---|
| Agent Analytics is available in Salesforce Enterprise, Performance, and Unlimited Editions with Salesforce Foundations or Agentforce 1 Edition. Agent Analytics is available in sandbox, DC1, and Government Cloud organizations. |
Service Agent Analytics Dashboard
Access the dashboards from the Agentforce Studio Analytics tab. Then, select your agent from the dropdown menu. The Service Agent Analytics dashboard provides insights into customer-facing agents, helping you track customer engagement, deflection rate, and additional metrics. Use this dashboard to optimize agents that interact with external customers.
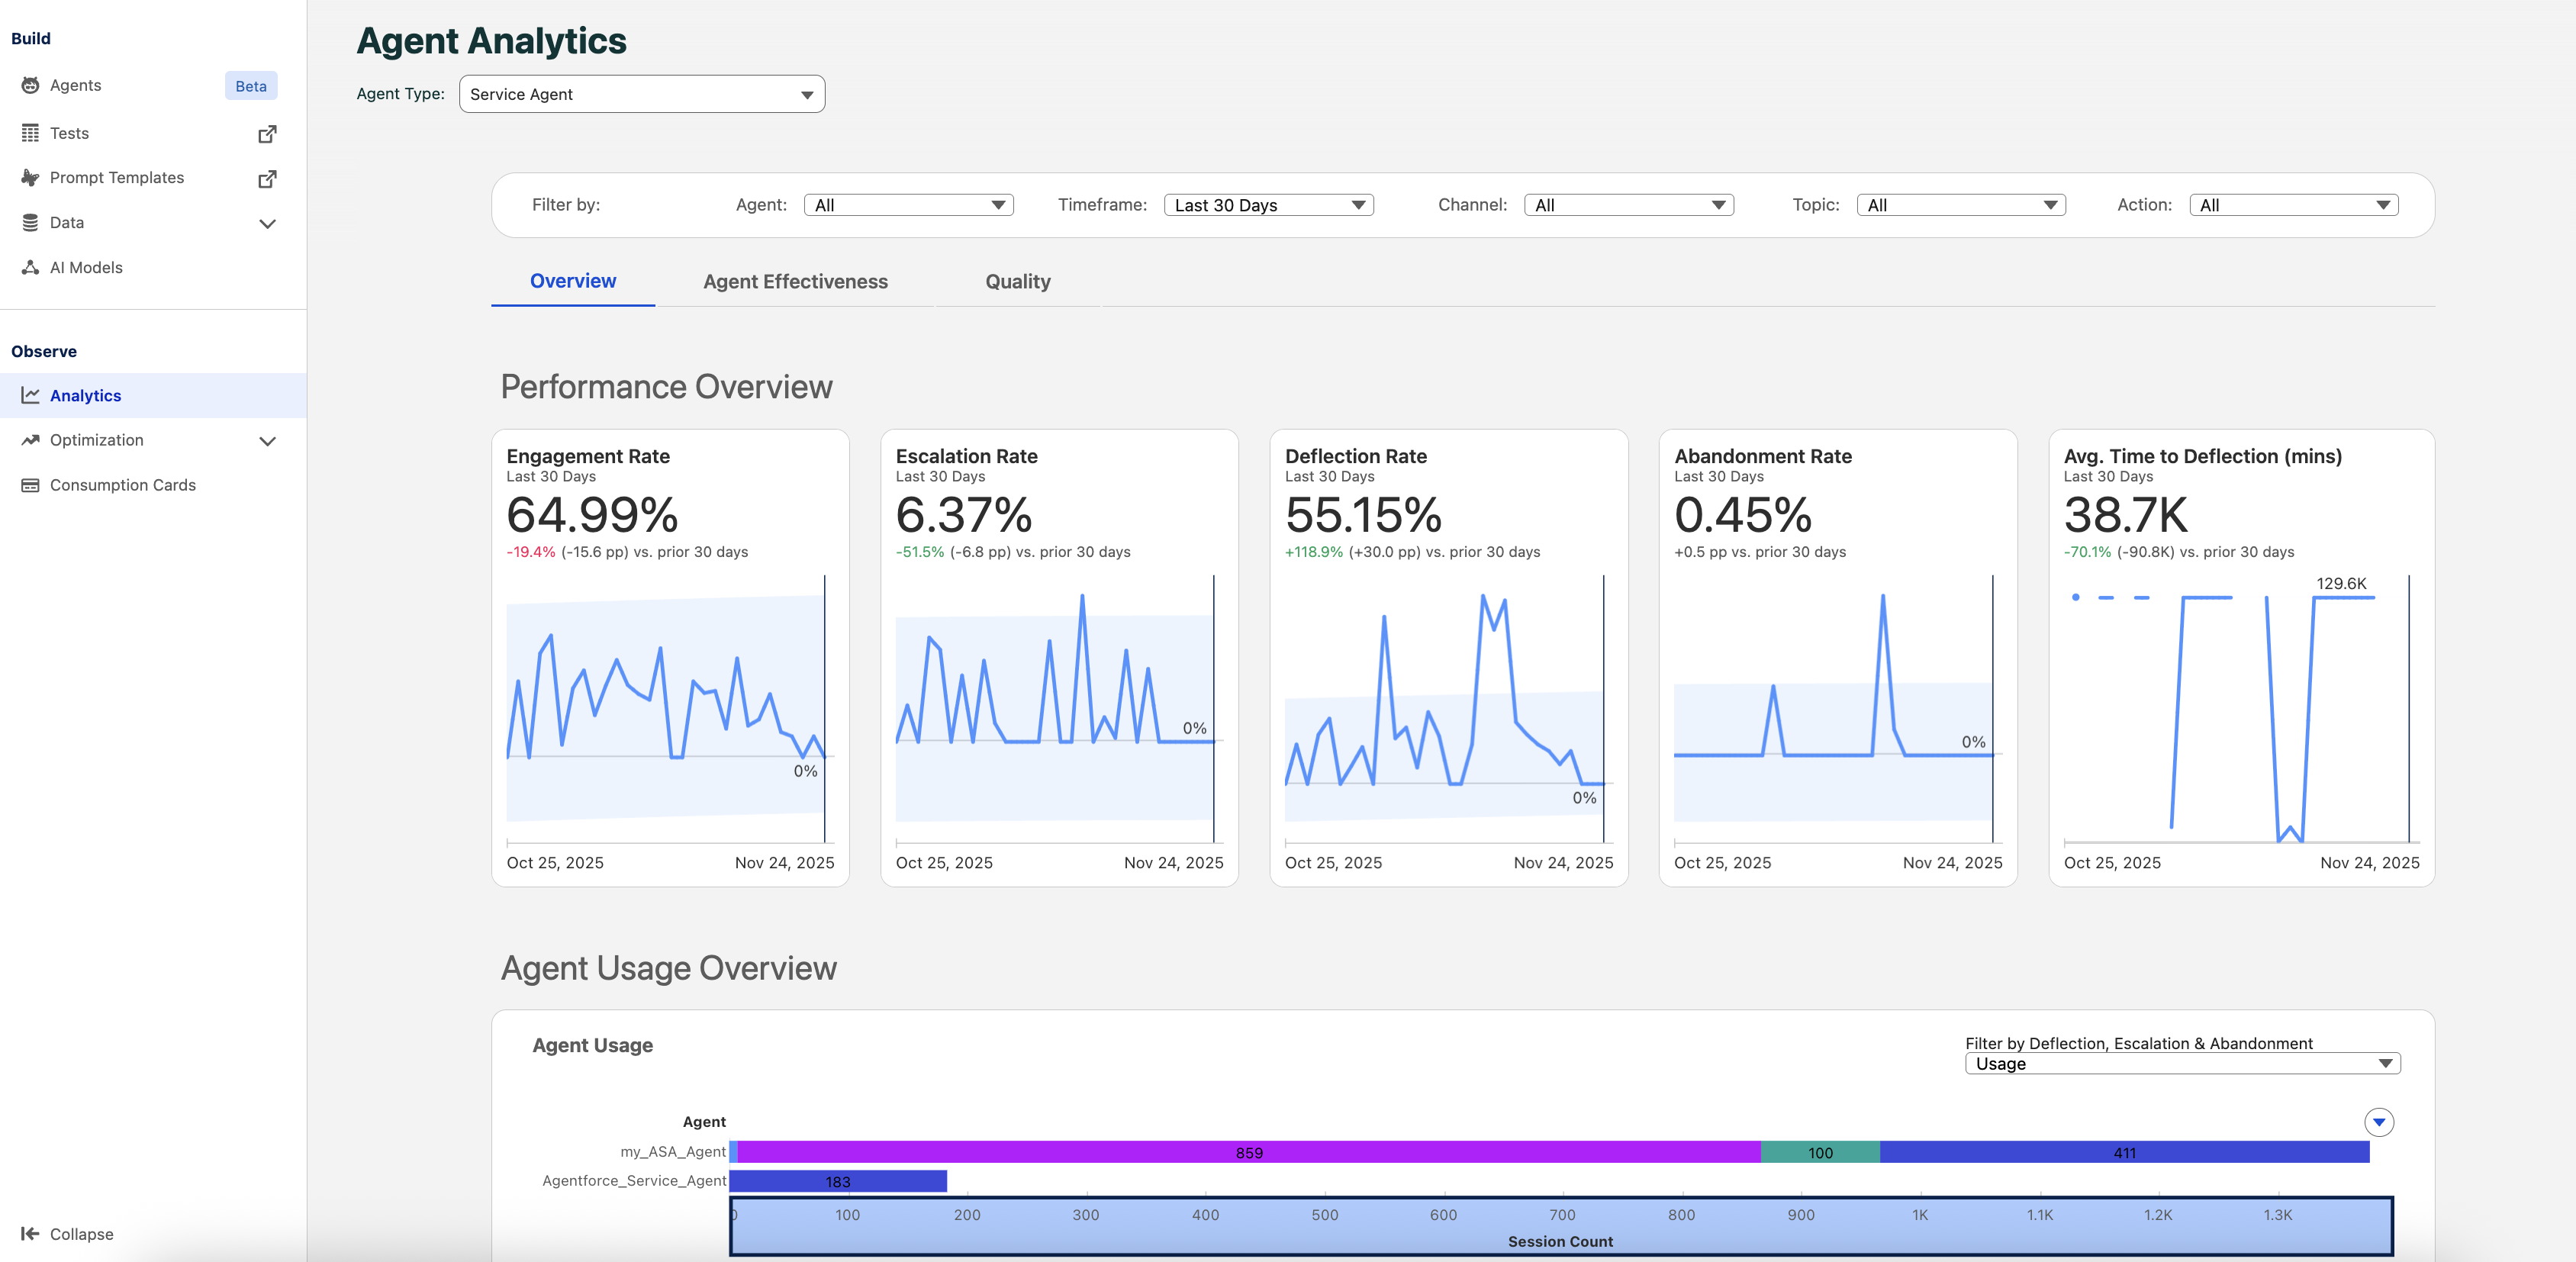
In the Service Agent Analytics dashboard, filter the content and views by Agent, Timeframe, Channel, Subagent, or Action. The dashboard includes three tabs: Overview, Agent Effectiveness, and Quality.
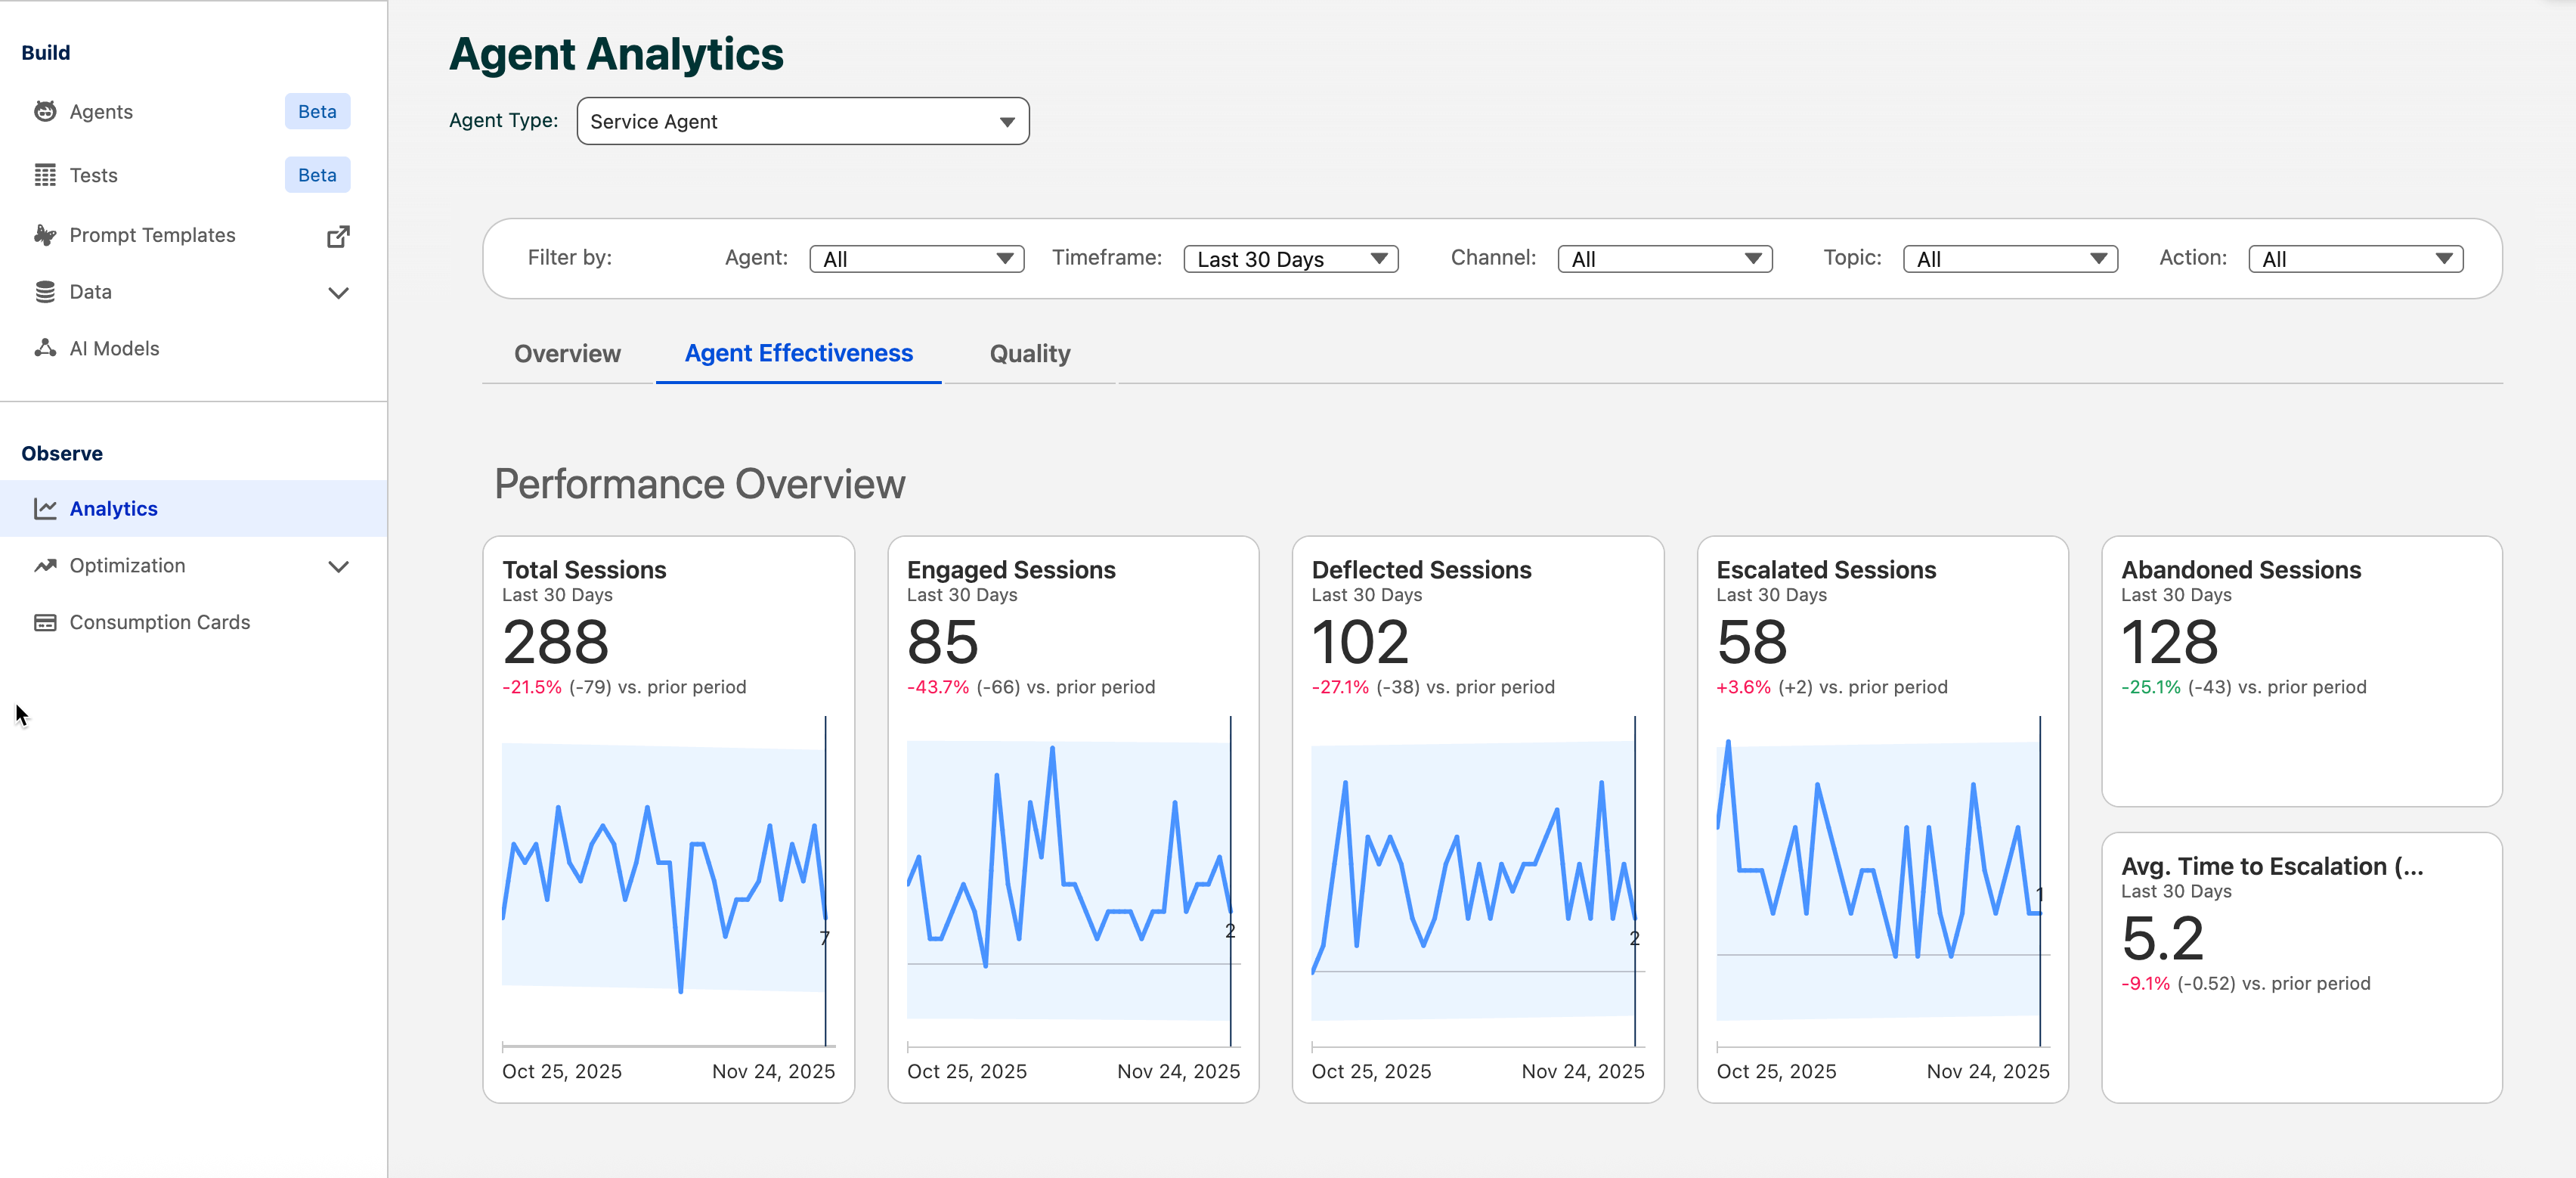
Agent Effectiveness Tab:
The Agent Effectiveness tab provides detailed metrics about agent performance. View session trends over time, understand session outcomes, and get detailed info for specific sessions.
| METRIC | DESCRIPTION |
|---|---|
| Total Sessions | Sum of all sessions, including engaged and unengaged sessions, and deflected, abandoned, and escalated sessions. |
| Engaged Sessions | Sum of engaged sessions where customers interacted with Service Agents. |
| Deflected Sessions | Sum of sessions that were successfully deflected without escalation. |
| Escalated Sessions | Number of sessions that were escalated to a higher level of support. |
| Abandoned Sessions | Number of abandoned sessions (sessions that timed out without engagement). The default session timeout is two hours. |
| Avg Time to Escalation | The average time (in minutes) for sessions to be escalated to a higher level of support. |
Quality Tab:
The Quality tab provides metrics about agent response quality. Monitor the average quality score over time and compare quality scores across different agents to identify areas for improvement.
Quality scores are calculated by an external LLM that evaluates how well your agent responds to user requests on a scale from 1 (lowest) to 5 (highest). This scoring system helps you identify which interactions need improvement and track your agent's performance over time.
| METRIC | DESCRIPTION |
|---|---|
| Average Quality Score | The overall quality score averaged across all agent interactions over the selected timeframe. |
| Average Quality Score by Agent | A comparison chart showing the average quality score for each individual agent, helping identify high and low performers. |
Employee Agent Analytics Dashboard
Use your Employee Agent Analytics dashboard to gain insights into employee-facing agents and track internal adoption, productivity, and effectiveness.
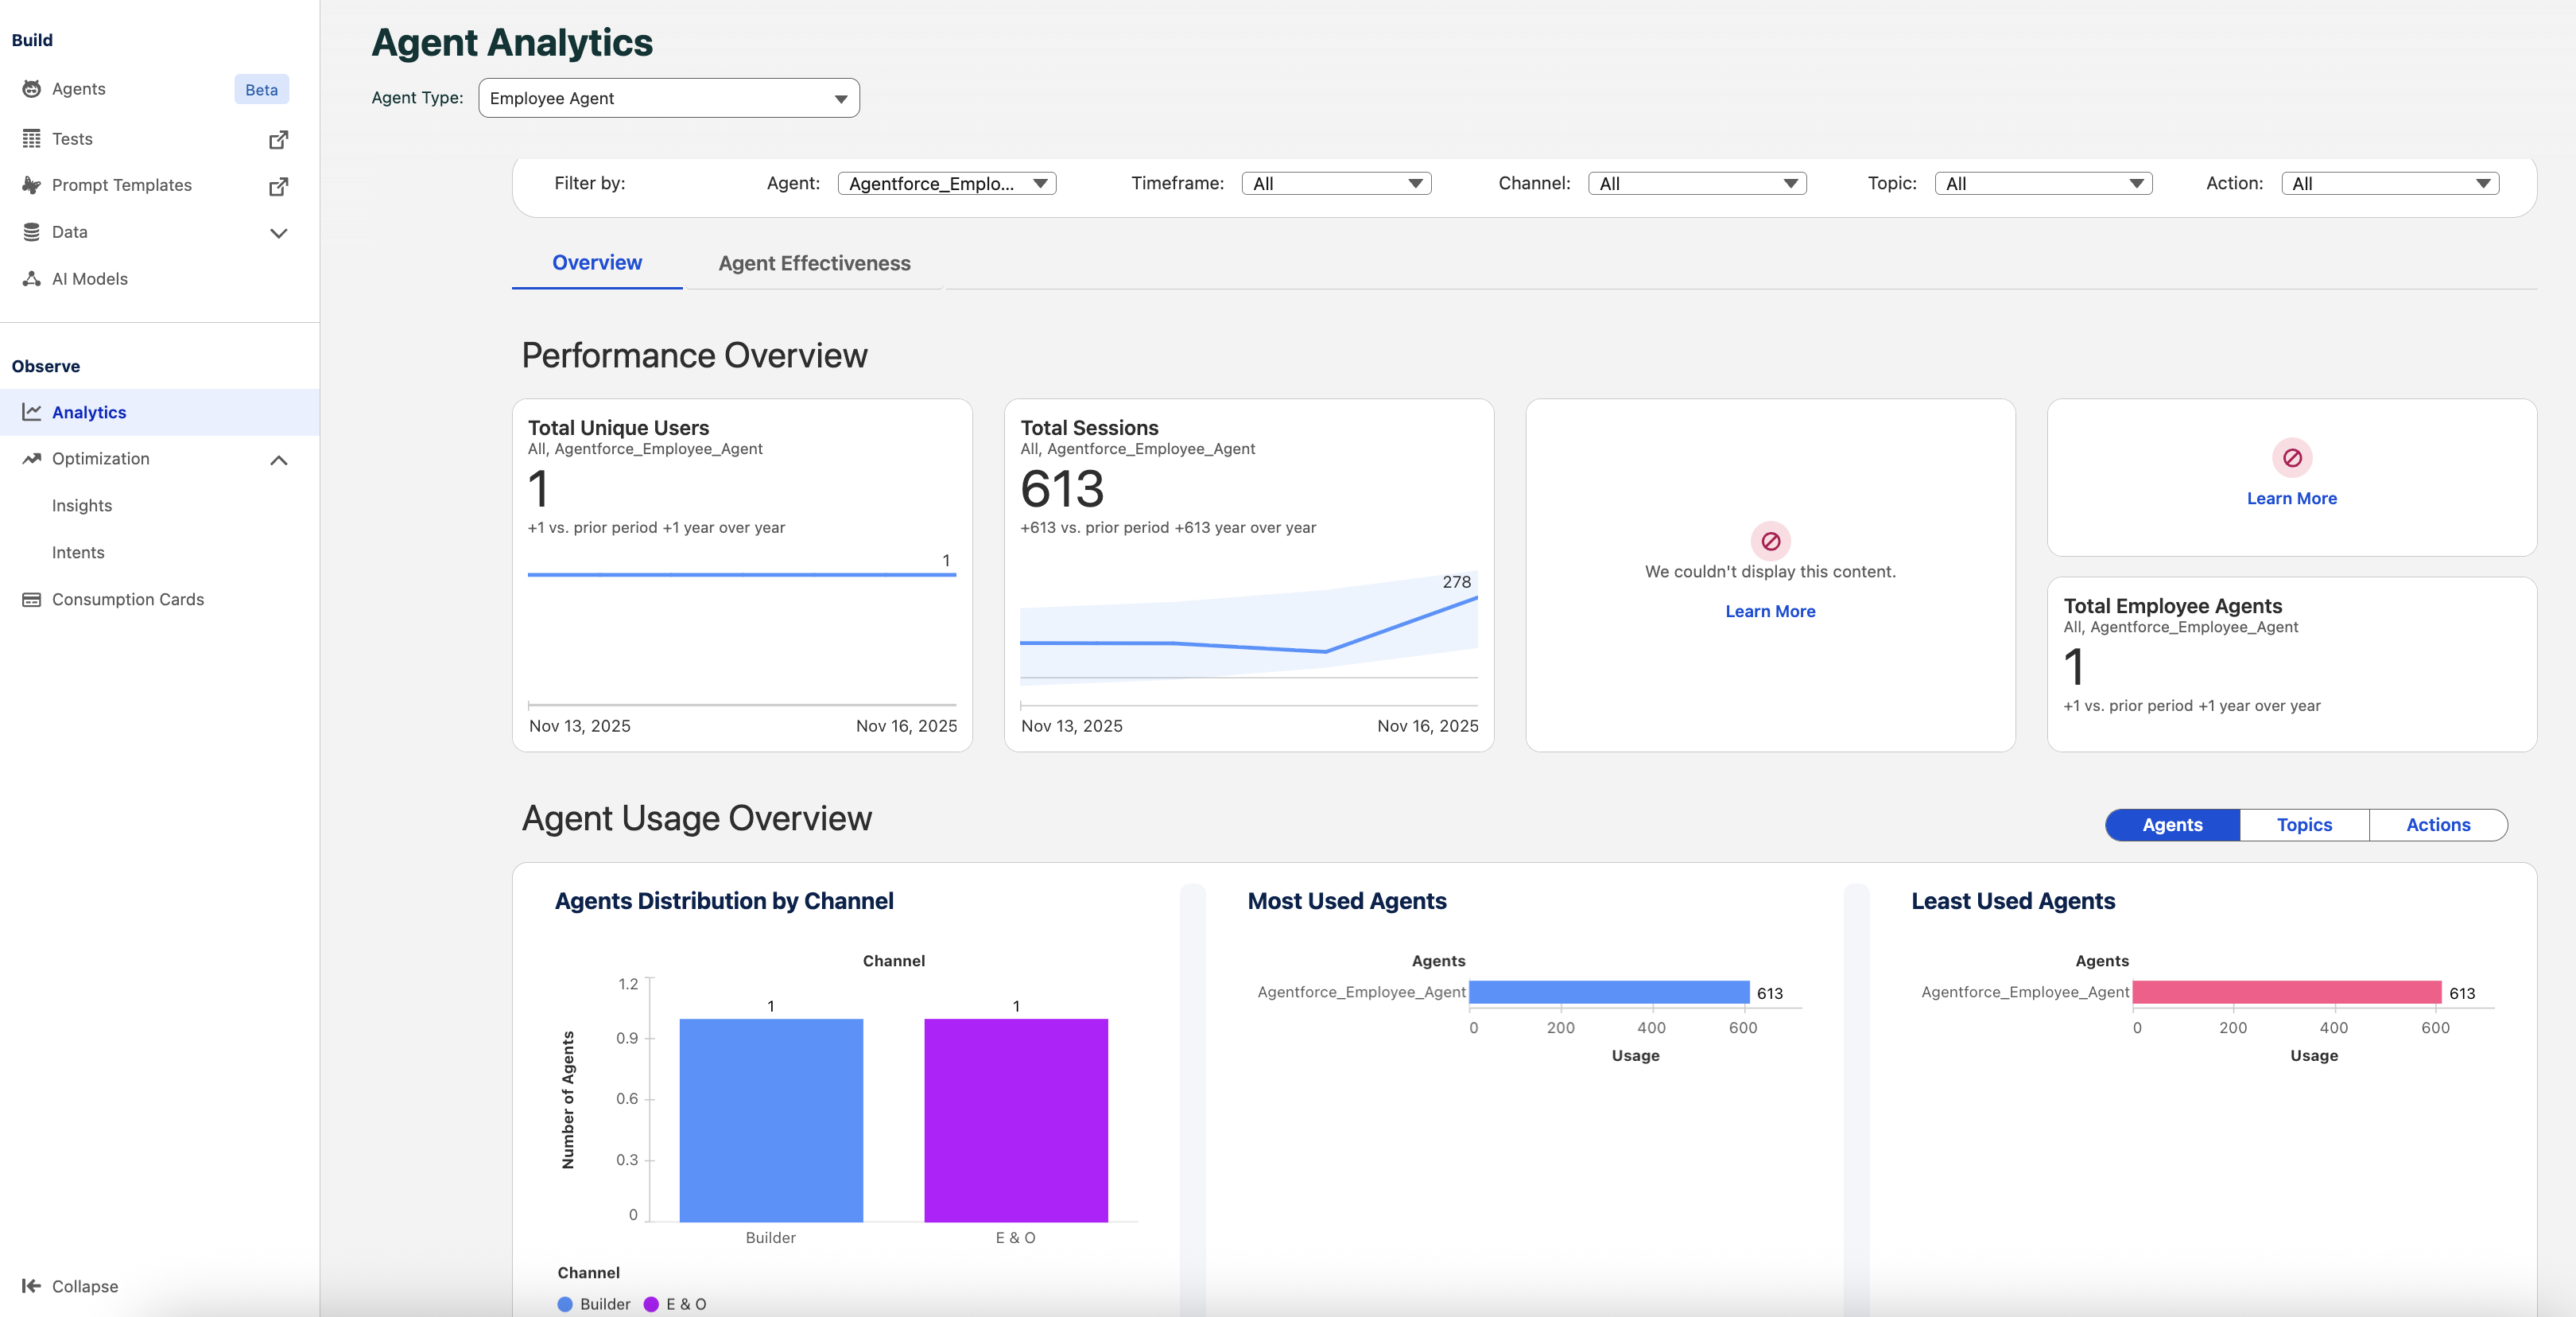
Filter the content and views by Agent, Timeframe, Subagent, or Action. Review key insights and metrics to understand how employees are engaging with agents and identify opportunities to enhance agent performance and drive adoption.