
You are here:
Field Service Analytics Prebuilt Dashboard
The Field Service Analytics app includes prebuilt dashboards to accelerate Field Service data exploration.
Required Editions
| User Permissions Needed | |
|---|---|
| To use CRM Analytics apps: | Use CRM Analytics Templated Apps |
| To use Field Service Analytics: | “Access Service Cloud Analytics Templates and Apps” |
| To create and manage CRM Analytics apps: | Manage CRM Analytics Templated Apps |
| “Edit CRM Analytics Dataflows” | |
For the latest in CRM Analytics, check out Field Service Intelligence Dashboards.
The prebuilt dashboards in the Field Service Analytics app contain key performance indicators that help you get value from your Salesforce field service data—fast. The dashboards help you understand key elements of customer service work order status and field team performance. You can prioritize customer service engagements, make technician utilization decisions, and quickly drill down to isolate problems and take action. Quickly review first-time fix rates, utilization, SLA compliance, and travel-time analysis. Start from a territory overview of all accounts, products, and teams and zoom into the technician and work order level.
The following table guides you through Field Service Analytics dashboards. You can also explore further on your own at any point. To learn more about exploring data in CRM Analytics, see Explore and Visualize Your Data.
| Dashboard Name | Contents | Target User Role |
|---|---|---|
| Work Order Performance | Service managers start here for a summary of KPIs. Review work order volume, average work time, average travel times, and first-time fix rate. Also review technician agent data, including the number of work orders per technician, their planned and actual travel times, and utilization rates. | Service manager/dispatcher |
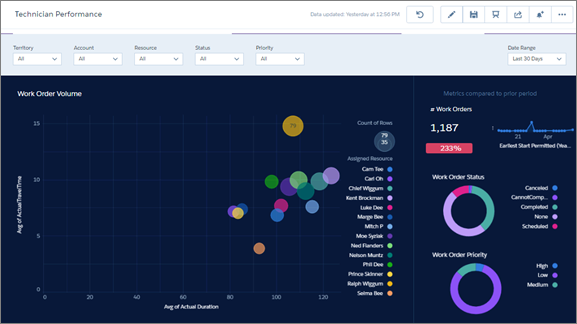
| Technician Performance | Focuses on each technician’s work order volume. Review agent-by-agent work order prioritization, travel time, first-time fix rates, mean time to repair, due date and SLA violations. | Service manager |
| Service Resource | Shows time spent by an individual technician on each type of job so managers can assess technicians’ efficiency. Also shows average number of jobs completed by the technician for a specific date range, the worker’s first-time fix rate, and actual versus estimated travel times to job sites. Embeddable in technicians’ pages so they can monitor their own efficiency KPIs. | Service manager and technician |
| Service Territory | Service managers can see the types of jobs completed in their territories—for example, HVAC, electrical, or plumbing—to ensure that their team members have the skills they need. They can also see the daily average number of jobs completed, technician utilization rate, and actual versus estimated technician travel times. | Service manager |