
You are here:
Sales Analytics Executive Overview – Pipeline Performance Dashboard
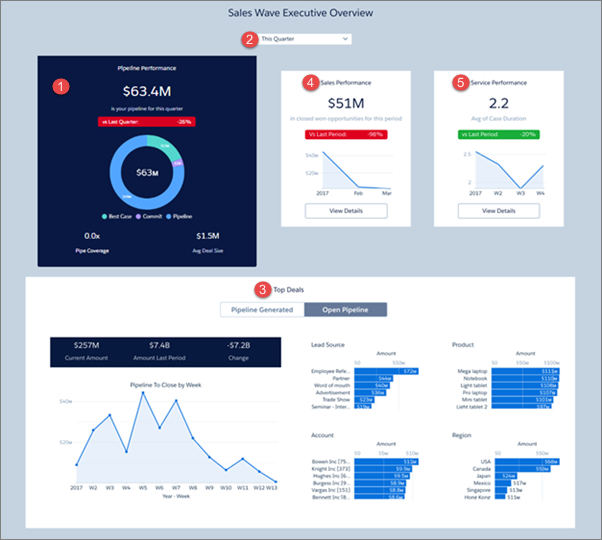
Sales executives get instant pipeline status. You can view the current amount in the pipe, comparison to the previous period, projected closing, and top deals by lead source, product, account, and region. Also get top-level views of sales and service performance.
Default Behavior and Recommended Options
Pipeline Performance chart (1) shows results for the current quarter. View results from a different period by changing the selection in the filter at top (2). Also shows pipeline coverage for the period, assuming you track quotas for your team. And shows average deal size for open opportunities set to close that period.
Top deals widget (3) defaults to deals set to close during selected period (Open Pipeline). Switch toggle to Pipeline Generated to see deals generated during the period.
To view sales and service performance overviews, click View Details buttons in Sales Performance (4) and Service Performance (5) charts.
Wizard and Other Setup Options
- Products. Only included if you add Products to your app on the wizard page that lets you add objects.
- Services data. Only included if you add Cases to your app on the wizard page that lets you add objects.
Datasets Used
- Opportunities
- Opportunity Products (if you add Products to the app)
- User Allocation
- Pipeline Trending
- Cases (if you add Cases to the app)
KPI Calculations
Pipeline Performance
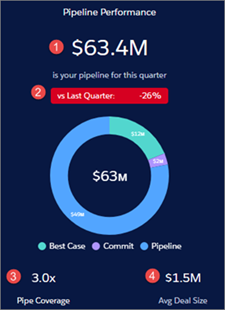
- (1) Pipeline Performance. Total amount open opportunities for selected period.
- (2) Comparison to prior period (quarter, year, month, and so on, depending on selected period). (Total amount open opportunities to date in selected period - Total amount open opportunities in prior period) / Total amount open opportunities in prior period. Prior period uses historical open pipeline amount.
- (3) Pipe coverage. Total open quota / Remaining quota for selected period. Remaining quota equals Sum of total sales rep quota - Closed won.
- (4) Avg Deal Size. Average Amount for open opportunities in selected period.
Top Deals
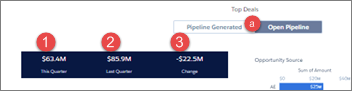
- (1) This period (quarter, year, month, and so on, depending on selected period). Either total open set to close this quarter or total created this quarter (open or closed) depending on whether you select Open Pipe or Pipe Generated (a).
- (2) Last period (quarter, year, month, and so on, depending on selected period). Either historical amount open at the same time last period or total pipeline generated last period.
- (3) Change. This Period - Last Period.
Product Name widget appears only if you add Products to your app.
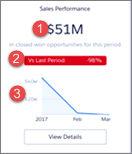
- (1) Sales performance. Total closed won in selected period.
- (2) Comparison to prior period (quarter, year, month, and so on, depending on selected period). (Total closed won in current period - total closed won prior period) / Total closed won prior period.
- (3) Total closed over time. Total closed won by week.
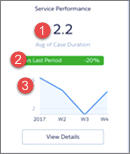
- (1) Service performance. Average days to close cases during selected period.
- (2) Comparison to prior period (quarter, year, month, and so on, depending on selected period). (Average time to close in selected period - Average time to close in prior time period) / Average time to close in prior time period.
- (3) Timeline. Average time to close cases by week.