
You are here:
Sales Analytics Executive Overview – Sales Performance Dashboard
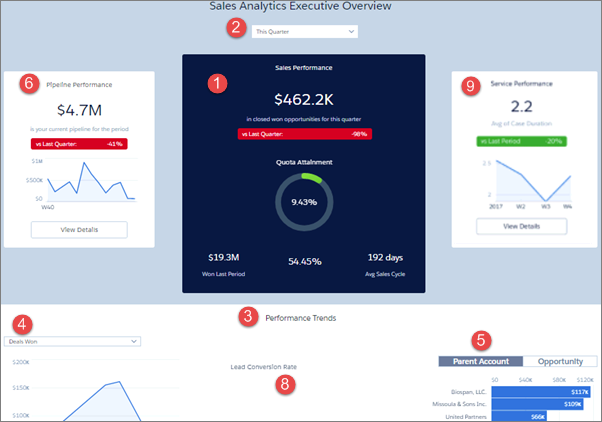
Sales executives get instant insight into closed business and quickly recognize trends. See bookings for the period, changes from previous period, as well as win rate, lead conversion rate, and top deals. Also see top-level views of pipeline and service business.
Default Behavior and Recommended Options
Sales Performance chart (1) shows results for the current quarter. View results from a different period by changing the selection in the filter at top (2)
Performance Trends chart (3) defaults to closed won opportunities. View other closed opportunities (such as lost) by changing the filter (4) selection.
Top deals widget (5) defaults to accounts. Toggle between Parent Account and Opportunity.
To view pipeline and service performance overviews, click View Details buttons in Pipeline Performance (6) and Service Performance (7) charts.
Wizard and Other Setup Options
- Lead Conversion Rate (8). Only included if you add Leads to the app with the wizard page that lets you add objects.
- Service Performance (7). Only included if you add Cases to your app on the wizard page that lets you add objects.
Datasets Used
- Opportunities
- User Allocation
- Leads (if you add Leads to the app)
- Cases (if you add Cases to the app)
KPI Calculations
Sales Performance
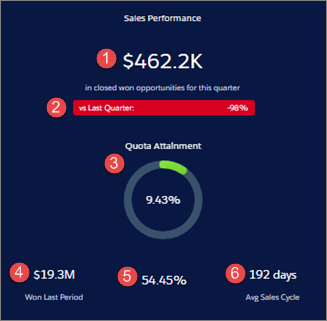
- (1) Sales Performance. Total closed won in selected period.
- (2) Comparison to prior period (quarter, year, month, and so on, depending on selected period) (Total closed won to date in current period - Total closed won prior period) / Total closed won prior period.
- (3) Quota Attainment. Total quota / Total closed. Based on sum of all sales rep quotas.
- (4) Won Last Period. Total won in prior selected period (quarter, year, month, etc., depending on selected period).
- (5) Win rate. Total closed won amount / Total closed amount win rate. Total closed won amount / Total closed amount.
- (6) Avg Sales Cycle. Average time to close for all closed won opportunities.
Performance Trends
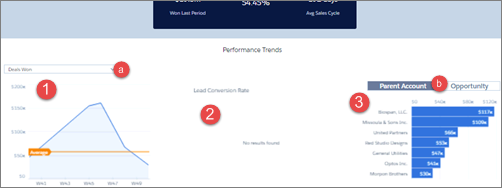
- (1) Deals over time. Either closed won or closed lost depending on filter (a) selection, week by week for selected period. Average line shows average closed won or lost.
- (2) Lead Conversion Rate. Leads converted to closed won opportunities / Total leads created in selected period, by week. Only shows if customer adds leads when creating app with wizard. (Not shown in images.)
- (3) Top accounts or opportunities. Depending on toggle (b) selection, shows top deals according to opportunity name or account name (or parent account name if your org uses account hierarchy, as shown in image). Shows either top closed won or closed lost depending on filter (a) selection.
Product Name widget appears only if you add Products to your app.
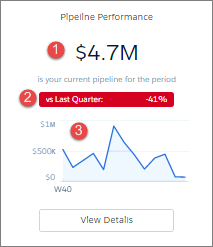
- (1) Pipeline Performance. Total open opportunity amount for selected period.
- (2) Comparison to prior period (quarter, year, month, and so on, depending on selected period). (Total open opportunity amount to date this period - Total open opportunity amount in prior period) / Total open opportunity amount in prior period. Prior period uses historical open pipeline amount.
- (3) Open deals over time. Open deals by week of close date.
Service Performance
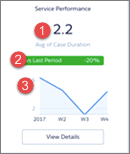
- (1) Service performance. Average days to close cases during selected period.
- (2) Comparison to prior period (quarter, year, month, and so on, depending on selected period). (Average time to close in selected period - Average time to close in prior time period) / Average time to close in prior time period.
- (3) Timeline. Average time to close cases by week.