
You are here:
Sales Analytics Forecast Dashboard
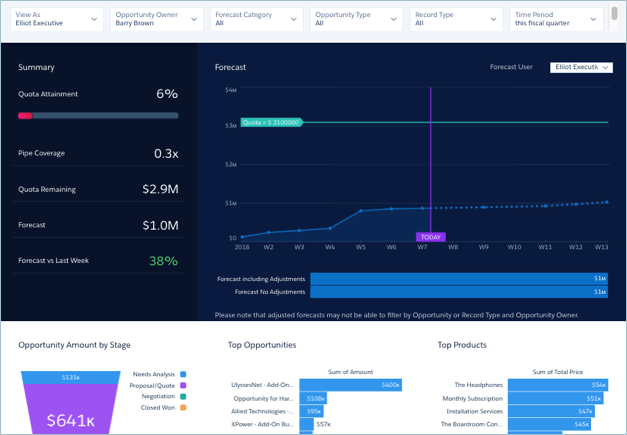
View quota attainment and forecast for each member of the team, and fine-tune the forecast by reviewing opportunities by stage in a selected period.
Default Behavior and Recommended Options
If your org uses the Salesforce Forecasting feature in Sales Cloud, the dashboard shows opportunity forecast and forecasts with manager adjustments. Historical opportunity data draws from the standard Opportunity Amount field.
Select from the Forecast User filter to view forecast for each team member.
Change the Time Period filter to Next Month or Next Quarter to identify possible opportunities to move into the current period. When you choose other categories from the Forecast Category filter, the Pipe Coverage metric changes accordingly.
Wizard and Other Setup Options
View As filter. If Salesforce is set up to use the Salesforce Forecasting feature in Sales Cloud, the filter shows forecast usernames. If your org doesn’t use forecasting, filter shows role developer names. In either case, pipe rolls up to the selected user. If your org doesn’t use Salesforce role hierarchy, this filter does not appear.
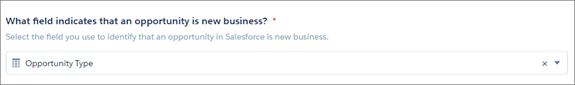
Opportunity Type filter. Values shown determined by selection made in wizard page 5, question 3. By default, the filter uses the standard Opportunity Type field.
Quotas. Dashboard automatically includes quota information from Salesforce Forecasting Quotas if your org uses this feature. If it does not, you can manually upload quotas data into the app from an external tool as a CSV file. See Forecasting and Quotas Data in Sales Analytics.
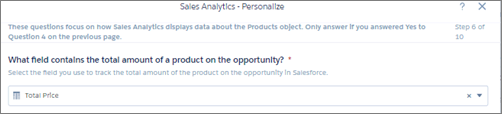
Products. Dashboard includes products if you include products (opportunity line items) when you create the app. Top products are sorted by the product amount selected in the wizard, page 6, question 1.
Opportunity Details chart. Amount column changes to Schedule Amount, Close Date column changes to Schedule Date if you select Product Schedules on page that lets you add data to the app.
Supports Opportunity Splits if the feature is enabled in your org. See Opportunity Splits.
Datasets Used
- Opportunities (or Opportunity Splits)
- Users
- User Allocation
- Forecasting Item (if org uses Salesforce Forecasting)
- Oppty Products (if you set up app with products)
- Pipeline Trending (for Forecast last week comparison)
KPI Calculations
Filters at Top
- View As. Role developer names or forecast managers, depending on how app is set up.
- Opportunity Owner. Any user who has ever owned an opportunity, including inactive users or users who do not own any deals in the selected period.
- Forecast Category. Values from standard opportunity forecast category field.
- Opportunity Type. Values from standard opportunity type field, or another field selected during app setup.
- Record Type. Opportunity record type names defined in your org.
- Time Period. Based on Salesforce fiscal year settings.
Summary (Top Left Panel)
- Quota Attainment. Closed won / Quota amount per opportunity owner based on close date and quota date in selected period. Can include future closed opportunities.
- Pipe Coverage. Open pipeline/ Remaining quota per opportunity owner based on selected period. Comparisons are to date. Does not include future closed opportunities.
- Quota Remaining. Quota amount - Closed won based on close date and quota date in selected period.
- Forecast. Closed won + Number of categories selected in Forecast Category filter. Can include opportunities set to close outside of selected period.
- Forecast vs Last Week. Current opportunity forecast amount for categories selected in Forecast Category filter compared with historical opportunity amount for the same categories.
Forecast (Top Right Panel)
- Forecast. Cumulative forecast for categories selected Forecast Category filter. Based on opportunity close date within selected period.
- Forecast No Adjustments/Forecast including adjustments. Total opportunity amount of forecast for categories selected Forecast Category filter compared with adjusted forecast for user selected in Forecast User filter.
Charts at Bottom
- Opportunity Amount by Stage. Opportunities grouped by stage based on close dates within selected period and other values selected in filters.
- Top Opportunities. Total amount open for selected opportunity owner based on close date in selected period.
- Top Products. Top products based on total product amount for all opportunities in forecast.